
FIGURE
Figure 7
- ID
- ZDB-FIG-201121-18
- Publication
- Zhang et al., 2020 - Tnni1b-ECR183-d2, an 87 bp cardiac enhancer of zebrafish
- Other Figures
- All Figure Page
- Back to All Figure Page
Figure 7
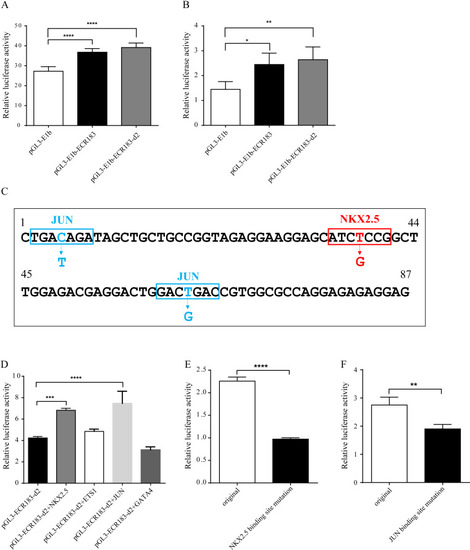
Enhancer activity identification of tnni1b-ECR183 and tnni1b-ECR183-d2 by the luciferase assay in the HEK293 (A) and HL1 cell lines (B). (C) Putative TFBS positions and mutations. Analysis of the enhancer activity of tnni1b-ECR183-d2 after putative TFs were overexpressed (D) or after NKX2.5 (E) and JUN (F) binding sites were mutated. One-way ANOVA was used to test for homogeneity of variance, and Bonferroni’s test was used to correct for multiple comparisons (A, B, D). A |
Expression Data
Expression Detail
Antibody Labeling
Phenotype Data
Phenotype Detail
Acknowledgments
This image is the copyrighted work of the attributed author or publisher, and
ZFIN has permission only to display this image to its users.
Additional permissions should be obtained from the applicable author or publisher of the image.
Full text @ Peer J.