
Figure 8
- ID
- ZDB-FIG-201121-19
- Publication
- Zhang et al., 2020 - Tnni1b-ECR183-d2, an 87 bp cardiac enhancer of zebrafish
- Other Figures
- All Figure Page
- Back to All Figure Page
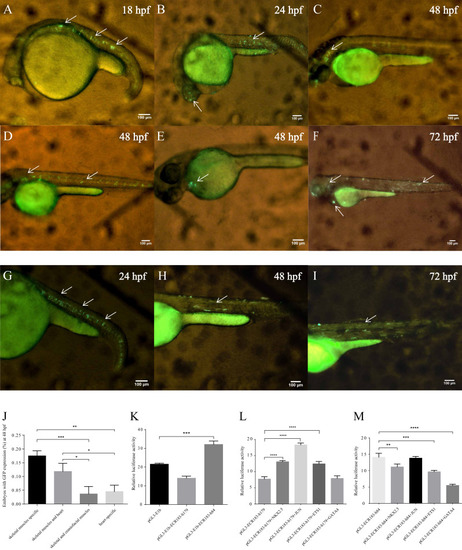
(A–F) Lateral views of zebrafish embryos with GFP expression after injection with tol2 mRNA and tnni1b-ECR183-h179. (G–I) Lateral views of zebrafish embryos with GFP expression after injection with tol2 mRNA and tnni1b-ECR183-h84. The arrowheads indicate GFP expression in the skeletal muscles (A, B, D, F, G, H, I), craniofacial muscles (B, C, D, F) and hearts (E, F), scale bars = 100 µm. Rate of embryos with GFP expression in different tissues after injection with tnni1b-ECR183-h179 (J). Enhancer activity identification of tnni1b-ECR183-h179 and tnni1b-ECR183-h84 in HEK293 cell lines (K). Analysis of the enhancer activity of tnni1b-ECR183-h179 (L) and tnni1b-ECR183-h84 (M) after putative TFs were overexpressed. One-way ANOVA was used to test for homogeneity of variance, and Bonferroni’s test was used to correct for multiple comparisons. * |