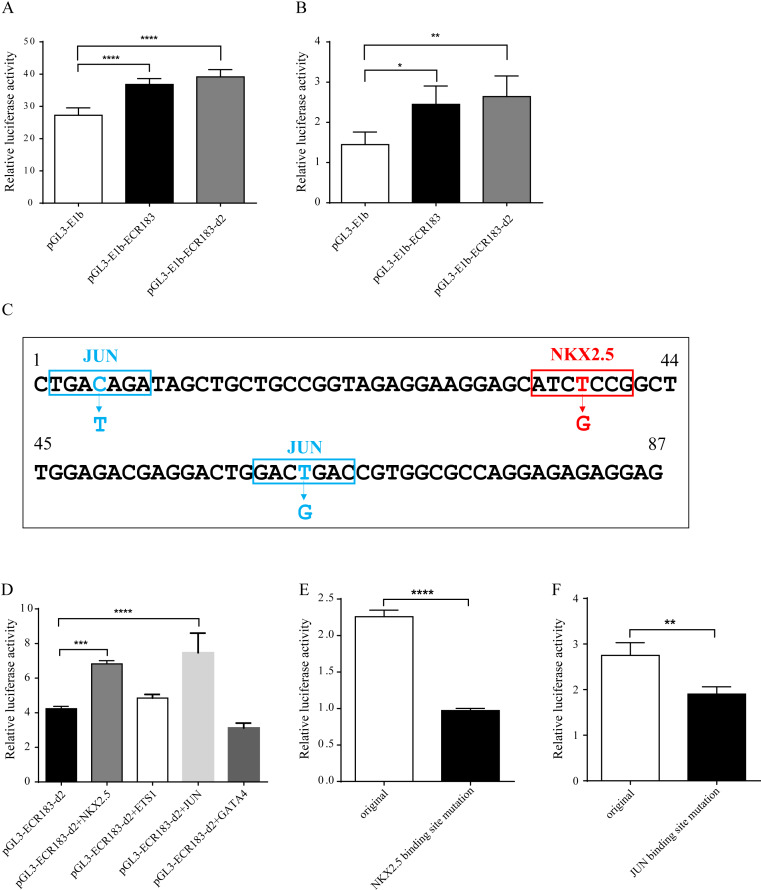
IMAGE

Figure 7

ID
ZDB-IMAGE-201121-21
Source
Figures for Zhang et al., 2020
Image
Figure Caption

Figure 7 Identification of the enhancer activity and analysis of putative TFBSs.

Enhancer activity identification of tnni1b-ECR183 and tnni1b-ECR183-d2 by the luciferase assay in the HEK293 (A) and HL1 cell lines (B). (C) Putative TFBS positions and mutations. Analysis of the enhancer activity of tnni1b-ECR183-d2 after putative TFs were overexpressed (D) or after NKX2.5 (E) and JUN (F) binding sites were mutated. One-way ANOVA was used to test for homogeneity of variance, and Bonferroni’s test was used to correct for multiple comparisons (A, B, D). A t-test was performed for statistical analyses between two groups (E, F). * p < 0.05; ** p < 0.01; *** p < 0.001; **** p < 0.0001, n = 3.

Acknowledgments
This image is the copyrighted work of the attributed author or publisher, and ZFIN has permission only to display this image to its users. Additional permissions should be obtained from the applicable author or publisher of the image. Full text @ Peer J.