
Fig. 2
- ID
- ZDB-FIG-201013-9
- Publication
- Kushawah et al., 2020 - CRISPR-Cas13d Induces Efficient mRNA Knockdown in Animal Embryos
- Other Figures
- All Figure Page
- Back to All Figure Page
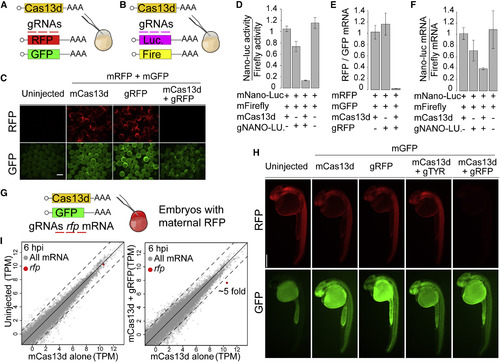
CRISPR-RfxCas13d Specifically Targets Reporter mRNAs in Zebrafish Embryos (A and B) Schematics of (A) rfp and gfp mRNAs or (B) nano-luciferase and firefly mRNAs (10 pg/embryo) co-injected with/without mCas13d (200 pg/embryo) and/or gRNAs (250–400 pg/embryo) targeting rfp or nano-luciferase mRNA, respectively. (C) Fluorescence images of representative embryos at 6 hpi with indicated mRNAs and gRNAs (scale bar, 0.5 mm). (D) Ratio of nano-luciferase (nano-luc) activity normalized to firefly luciferase activities under indicated conditions at 6 hpi. Results are shown as the averages ± standard error of the mean from at least 11 biological replicates from two independent experiments (n = 5 embryos/biological replicate). p < 0.021, mCas13d and gNANO-LUC compared with other conditions (Kruskal-Wallis test). (E) qRT-PCR analysis of ratio of RFP reporter mRNAs under indicated conditions at 6 hpi normalized with gfp mRNA. Results are shown as the averages ± standard error of the mean from two independent experiments with at least 2 biological replicates per experiment (n = 20 embryos/biological replicate). p < 0.0001, mCas13d and gRFP compared with other conditions (one-way ANOVA). (F) Nano-luciferase (nano-luc) mRNA level normalized to firefly mRNA level at 6 hpi at indicated conditions. Results are shown as the averages ± standard error of the mean from two independent experiments with 2 biological replicates per experiment (n = 20 embryos/biological replicate). p < 0.05, mCas13d and gNANO-LUC compared with mCas13d alone or mNano-Luc and mFirefly alone (one-way ANOVA). (G) Schematic of mRNAs (Cas13d and gfp) and gRNAs targeting rfp introduced into embryos derived from transgenic mother expressing rfp. (H) Fluorescence images of representative embryos at 26 hpi injected with indicated mRNAs and/or gRNAs (scale bar, 0.5 mm). (I) Scatterplot showing mRNA level (RNA-seq) of zebrafish embryos at 6 hpi. Left panel, mRNA level of uninjected embryos versus embryos injected with mCas13d alone. Right panel, mRNA level of embryos injected with mCas13d plus gRFP versus embryos injected with mCas13d alone. Rfp mRNA is indicated in red. Dashed lines indicate a 4-fold difference between RNA levels. |
Reprinted from Developmental Cell, 54(6), Kushawah, G., Hernandez-Huertas, L., Abugattas-Nuñez Del Prado, J., Martinez-Morales, J.R., DeVore, M.L., Hassan, H., Moreno-Sanchez, I., Tomas-Gallardo, L., Diaz-Moscoso, A., Monges, D.E., Guelfo, J.R., Theune, W.C., Brannan, E.O., Wang, W., Corbin, T.J., Moran, A.M., Sánchez Alvarado, A., Málaga-Trillo, E., Takacs, C.M., Bazzini, A.A., Moreno-Mateos, M.A., CRISPR-Cas13d Induces Efficient mRNA Knockdown in Animal Embryos, 805-817.e7, Copyright (2020) with permission from Elsevier. Full text @ Dev. Cell