
Fig. 3
- ID
- ZDB-FIG-201013-8
- Publication
- Kushawah et al., 2020 - CRISPR-Cas13d Induces Efficient mRNA Knockdown in Animal Embryos
- Other Figures
- All Figure Page
- Back to All Figure Page
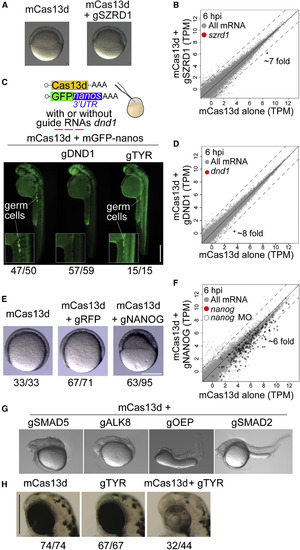
CRISPR-RfxCas13d Recapitulates Known Loss-of-Function Zebrafish Phenotypes (A) Representative pictures of zebrafish embryos (6 hpi) injected with mCas13d alone or mCas13d plus szrd1 gRNAs (gSZRD1) (scale bar, 10 μm). (B) Scatterplot showing mRNA level (RNA-seq) of zebrafish embryos injected with mCas13d (250 pg/embryo) alone versus mCas13d plus gSZRD1 (600 pg/embryo) after 6 hpi, szrd1 mRNA is indicated in red (>7-fold change). Dashed lines indicate a 4-fold difference between RNA levels. (C) Schematic of mCas13d (200–250 pg/embryo) and gfp mRNA containing the 3′UTR of nanos (40 pg/embryo) co-injected with/without gRNAs targeting dnd1 (500–600 pg/embryo) or tyr (500–600 pg/embryo). Germ cells are highlighted by germ-cell-specific fluorescence (due to nanos-3′UTR) at 30 hpf. The ratio of embryos displaying intact germ cells (mCas13d alone or mCas13d plus gTYR) or without germ cells (mCas13d plus gDND1) versus total number of analyzed embryos (at least from two independent experiments) are indicated (scale bar, 0.5 mm). (D) Scatterplot showing mRNA level (RNA-seq) of zebrafish embryos injected with mCas13d (250 pg/embryo) alone versus mCas13d plus dnd1 gRNAs (600 pg/embryo) after 6 hpi, dnd1 mRNA is indicated in red (~8-fold change). Dashed lines indicate a 4-fold difference between RNA levels. (E) Representative pictures of epiboly-stage zebrafish embryos displaying gastrulation and epiboly defects in embryos injected with mCas13d plus nanog gRNAs (gNANOG), but not in embryos injected with either mCas13d alone or mCas13d plus rfp gRNAs (gRFP). The ratios of embryos displaying normal development (mCas13d mRNA alone or mCas13d mRNA plus gRFP) or with epiboly and gastrulation defects (mCas13d mRNA plus gNANOG) versus total number of analyzed embryos are indicated. Embryos were injected with 250, 430, and 600 pg of mCas13d, gRFP, and gNANOG, respectively (scale bar, 0.1 mm). (F) Scatterplot showing mRNA level (RNA-seq) of zebrafish embryos injected with mCas13d plus gNANOG compared with embryos injected with mCas13d alone at 6 hpi. nanog mRNA is indicated in red. Black outline indicates genes that display reduced expression (>4-fold decrease) in nanog morpholino-treated (MO) embryos. Dashed lines indicate a 4-fold difference between RNA levels. (G) Representative pictures of zebrafish embryos injected with mCas13d plus the indicated gRNAs targeting smad5, alk8, oep, and smad2 mRNA showing the recapitulated phenotypes. (H) Pigmentation phenotypes (52 hpf) of head/eyes of embryos injected with mCas13d alone (300 pg/embryo, left), tyr gRNAs alone (600 pg/embryo, center), or both (right) (scale bars, 0.5 mm). The ratios of embryos displaying intact pigmentation (mCas13d or gTYR alone) or with the lack of pigmentation (mCas13d plus gTYR) versus total number of analyzed embryos are indicated. |
Reprinted from Developmental Cell, 54(6), Kushawah, G., Hernandez-Huertas, L., Abugattas-Nuñez Del Prado, J., Martinez-Morales, J.R., DeVore, M.L., Hassan, H., Moreno-Sanchez, I., Tomas-Gallardo, L., Diaz-Moscoso, A., Monges, D.E., Guelfo, J.R., Theune, W.C., Brannan, E.O., Wang, W., Corbin, T.J., Moran, A.M., Sánchez Alvarado, A., Málaga-Trillo, E., Takacs, C.M., Bazzini, A.A., Moreno-Mateos, M.A., CRISPR-Cas13d Induces Efficient mRNA Knockdown in Animal Embryos, 805-817.e7, Copyright (2020) with permission from Elsevier. Full text @ Dev. Cell