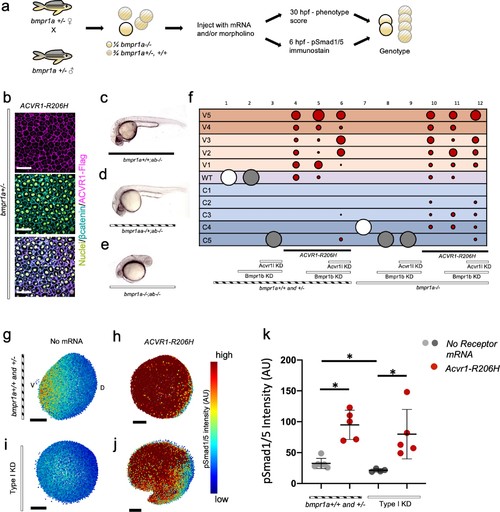
(a) Experimental workflow. bmpr1aa+/-; ab-/- fish were crossed with each other to generate bmpr1a+/- (bmpr1aa+/+; ab-/-), bmpr1a+/- (bmpr1aa+/-; ab-/-), and bmpr1a-/- (bmpr1aa-/-;ab-/-) embryos. One-cell stage eggs were injected with bmpr1ba, bmpr1bb morpholinos, and separately injected with an acvr1l morpholino to additionally knockdown these endogenous BMP receptors, and then were injected with ACVR1-R206H mRNA. Early gastrula (shield-65% epiboly) stage embryos were collected and fixed for immunostaining. At 12 to 30 hpf the remaining embryos were scored for DV patterning phenotypes. Following blindly immunostaining and imaging, or phenotyping, embryos were individually genotyped. (b) Representative immunostained embryo for ACVR1-Flag (magenta), β-Catenin (marking the cell membrane cyan), and nuclei (yellow) (N=5). (c-e) Representative 24 hpf phenotypes of (b) bmpr1aa+/+; ab-/-, (c) bmpr1aa+/-; ab-/-, and (d) bmpr1aa-/-; ab-/- embryos. (f) Injected embryo phenotypes at 12 to 30 hpf. Three pooled experiments. Columns: 1, N=104; 2, N=41; 3, N=69; 4, N=69; 5, N=78; 6, N=70; 7, N=36; 8, N=19; 9, N=25; 10, N=29; 11, N=23; 12, N=22. (g-j) Animal pole view of relative pSmad1/5 intensities (AU) within each nucleus in representative early-gastrula embryos. (d and f) Embryos are oriented with the ventral (V) side to the left and the dorsal (D) side to the right. (e and g) Dorsal side of the embryo could not be identified due to loss of the shield structure with ventralization. (g) bmpr1a+/- embryo (N=5). (h) bmpr1a+/- embryo injected with ACVR1-R206H mRNA (N=5). (i) bmpr1a-/- embryo with acvr1l and bmpr1b KD (Type I KD embryo) (N=4). (j) Type I KD embryo injected with ACVR1-R206H mRNA (N=5). (k) Mean nuclear pSmad1/5 fluorescence of injected embryos. Each dot represents the mean fluorescence of an individual embryo. Mean and standard deviation of each condition (e-h) is shown. * indicates P<0.05, ns indicates no significance.
|
