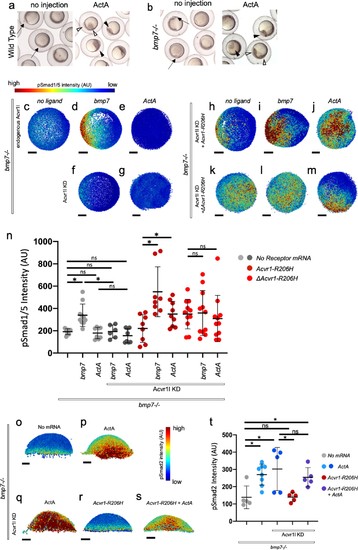
(a, b) Representative 6 hpf (shield stage) WT (a) and bmp7-/- (b) embryos uninjected or injected with Activin A mRNA. WT and bmp7-/- develop normal dorsal organizers (arrows). Activin A injection causes embryos to have expanded (filled arrowheads) or duplicated (empty arrowheads) dorsal organizers. (c–m) Animal pole view of pSmad1/5 intensities (using arbitrary units (AU)) within each nucleus of the embryo in representative bmp7-/- early gastrula (shield stage) embryos with endogenous Acvr1l present (c–e) or knocked down (f–m). Injected receptor mRNA is noted to the left and ligand mRNA is noted above. Embryos are oriented with the dorsal shield to the right. Scale bars = 100 μm. (c–e) bmp7-/- uninjected embryos (N = 8), or injected with bmp7 (N = 10), or Activin A (N = 8) mRNA. (f and g) bmp7-/-, acvr1l KD embryos injected with bmp7 (N = 6) or Activin A (N = 8) mRNA. (h–j) Acvr1-R206H injected bmp7-/-, acvr1l KD embryos with no injected ligand (N = 8), bmp7 (N = 8), or Activin A (N = 9) mRNA. (k–m) ΔAcvr1-R206H injected bmp7-/-, acvr1l KD embryos (N = 11), with injected bmp7 (N = 11), or Activin A (N = 11) mRNA. (n) Mean nuclear pSmad1/5 fluorescence of injected embryos. Each dot represents the mean fluorescence of an individual embryo. Mean and standard deviation of each condition is shown. * indicates p<0.05, ns indicates no significance. (o–s) Lateral views showing relative pSmad2 intensities (using arbitrary units (AU)) within each nucleus of the embryo in representative bmp7-/- early gastrula embryos (shield stage) with endogenous acvr1l present (i and j) or knocked down (k–m). Injected mRNA is noted above each image. Embryos are oriented with the presumptive dorsal side facing forward. Scale bars = 100 μm. (o) bmp7-/- embryo (N = 5) (p) Activin A injected embryo (N = 8) (q) Activin A injected embryo with Acvr1l knockdown (N = 5) (r) mAcvr1-R206H injected embryo with Acvr1l knockdown (N = 5) (s) mAcvr1-R206H and Activin A injected embryo with Acvr1l knockdown (N = 5) (t) Mean nuclear pSmad2 fluorescence of injected embryos. Each dot represents the mean fluorescence of an individual embryo. Mean and standard deviation of each condition is shown by bars. * indicates p<0.05, ns indicates no significance.
|
