
FIGURE
FIGURE 3
- ID
- ZDB-FIG-200829-55
- Publication
- Liu et al., 2020 - Genetic Deletion of miR-430 Disrupts Maternal-Zygotic Transition and Embryonic Body Plan
- Other Figures
- All Figure Page
- Back to All Figure Page
FIGURE 3
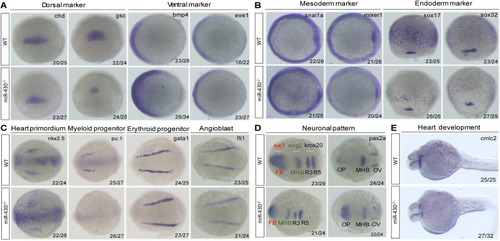
Marker gene analysis. Marker gene expression of the WT and |
Expression Data
| Genes: | |
|---|---|
| Fish: | |
| Anatomical Terms: | |
| Stage Range: | Shield to Prim-25 |
Expression Detail
Antibody Labeling
Phenotype Data
| Fish: | |
|---|---|
| Observed In: | |
| Stage Range: | Shield to Prim-25 |
Phenotype Detail
Acknowledgments
This image is the copyrighted work of the attributed author or publisher, and
ZFIN has permission only to display this image to its users.
Additional permissions should be obtained from the applicable author or publisher of the image.
Full text @ Front Genet