FIGURE

Figure 6

ID
ZDB-FIG-200821-13
Publication
Silic et al., 2020 - Potassium Channel-Associated Bioelectricity of the Dermomyotome Determines Fin Patterning in Zebrafish
Other Figures
All Figure Page
Back to All Figure Page
Figure 6

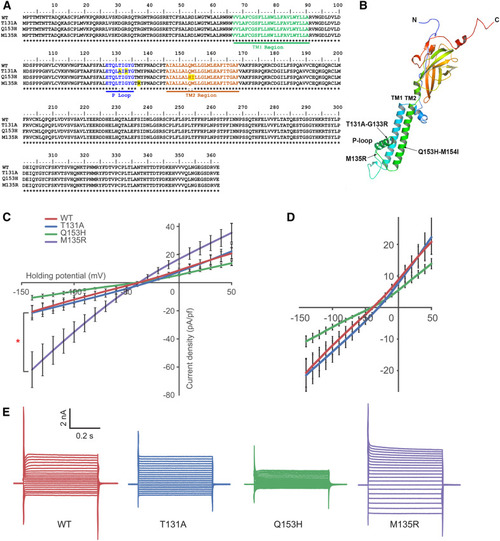
Generation of Kcnj13 mutants with different potassium conductance. (A) Protein sequence alignment of site-directed mutants. TM1, TM2, and P-loop domains are highlighted in green, brown, and blue, respectively. Altered amino acids are highlighted in yellow. (B) A computation-predicted three-dimensional structure of the Kcnj13 subunit. Mutated sites are indicated with arrows. (C) Conductance characterization of three Kcnj13 mutants compared to WT showing decreased conductance of Q153H (n = 12, P = 0.022) and increased conductance of M135R (n = 19, P = 0.020). The mutant T131A did not show a significant difference in conductance (n = 12, P > 0.9) compared to WT (n = 13). The current density was calculated by dividing current (pA) at each holding potential by the cell membrane capacitance (pF) to normalize the difference in the cell size. Statistical differences of mean values were calculated using a two-tailed Student’s t-test. (D) Replotted part of (C) with enlarged y-axis to show the difference between the T131A mutant and the WT in resting membrane potential (also see Figure S7). (E) Example recording traces from each mutant and WT channels. Holding potential was −80 mV and step size was 10 mV. P-loop, pore-forming; TM, transmembrane; WT, wild-type.

Expression Data

Expression Detail
Antibody Labeling
Phenotype Data

Phenotype Detail
Acknowledgments
This image is the copyrighted work of the attributed author or publisher, and ZFIN has permission only to display this image to its users. Additional permissions should be obtained from the applicable author or publisher of the image. Full text @ Genetics