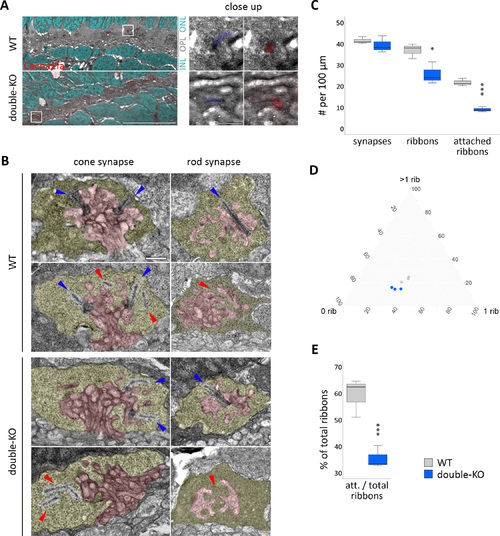
Ultrastructure of the photoreceptor ribbon synapse. (A) Correlative light- and electron microscopy (CLEM) on 5 dpf retinae of WT and double-KO. Cacna1fa puncta seem to be reduced in number in double-KO compared to WT, but both show correct localization of Cacna1fa to synaptic ribbons in the OPL (close up). Red: Cacna1fa antibody staining. Cyan: DAPI. Blue: pseudo-colored ribbon. White frame: close up region. Scale bar in overview corresponds to 10 μm and in close-up to 1 μm. (B) Transmission electron micrographs (TEM) of synapses in 5 dpf WT and double-KO. The presynaptic terminal is pseudocolored in yellow and the postsynaptic invaginations in red. Ribbons that are attached to the active zone are found in cones and rods of both genotypes (blue arrows), but also some that are ‘floating' or missing (red arrows). Scale bar: 0.5 μm. (C–E) Quantification of synapse and ribbon number or attachment on whole-retinal scans of three sections per genotype (one per individual). (C) The number of synapses per 100 μm in double-KO is normal, however the amount of ribbons is reduced and there are fewer ribbons attached to the active zone. (D) Ternary plot of synapse subtypes: 0 rib = empty synapses; 1 rib = synapses with one ribbon; >1 rib = synapses with more than one ribbon; grey = WT; blue = double-KO. The data from WT and double-KO form two separate clusters. The percentage of synapses harboring more than one ribbon (cones) is lower (P = 0.03) and that of empty synapses is higher (P = 0.05) in double-KO. 1-ribbon synapses do not seem to be affected. (E) The number of attached ribbons relative to the total number of ribbons is lower in double-KO retinae. Box and whisker plots: bottom and top of the box, first and third quartile; the median, line within the box; whiskers, minimum and maximum values. Significance levels: *P ≤ 0.05, **P ≤ 0.01, ***P ≤ 0.001.
|
