|
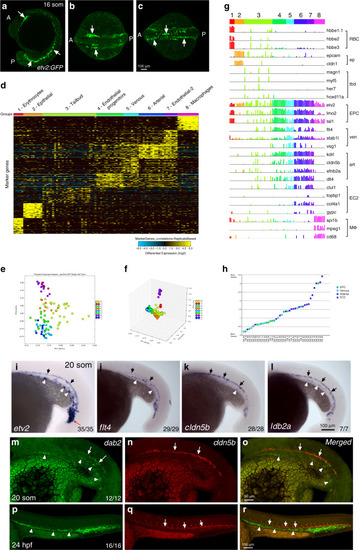
Single-cell RNA-seq analysis using Fluidigm cell sorting of <italic>Tg(-2.3 etv2:GFP)</italic> embryos at the 16–20-somite stage.a–c GFP expression in live embryos, maximum intensity projection is shown. Arrows label vascular endothelial cells and their progenitors. Ten embryos were imaged in two independent experiments and a representative embryo is shown. a lateral view; b anterior view, c dorsal view. A anterior, P posterior. d Heatmap view of marker gene expression in different cell clusters. A complete list of differentially expressed genes is presented in Supplementary Data 5. e, f 2-D and 3-D principal component analysis plots of different cell clusters. Cluster names are the same as in (d). g Relative marker gene expression in different cell clusters. Vertical bars depict log-normalized gene expression. h An Arteriovenous (A-V) index of different endothelial cells. Note that many cells are positive for both arterial and venous marker expression. i–l ISH expression analysis of key marker genes for EPC (etv2), venous (flt4), arterial (cldn5b), and EC-2 (ldb2a) populations in the trunk region at the 20-somite stage. Black arrows label the DA and white arrowheads label venous progenitors which are starting to coalesce into the PCV. Note that flt4 is enriched in the PCV while cldn5b and ldb2a label the DA. m–r Two color ISH analysis for the expression of venous dab2 and arterial cldn5b at the 20-somite and 24 hpf stages. Arrows label the DA while arrowheads mark the PCV or its progenitors. Note that dab2 and cldn5b are co-expressed in the DA progenitors at the 20-somite stage but not at 24 hpf. In all panels, the numbers in the lower right corner display the number of embryos showing the expression pattern out of the total number of embryos analyzed in two replicate experiments.
|