|
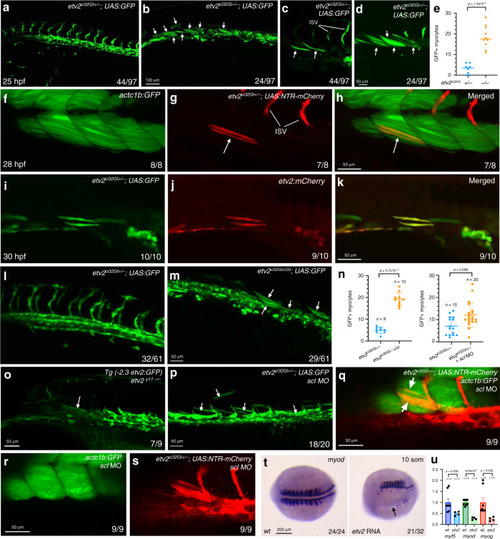
<italic>Etv2-</italic>expressing cells differentiate as skeletal muscle cells in the absence of <italic>etv2</italic> function.a–d Trunk region of etv2ci32Gt; UAS:GFP embryos at 25 hpf. Maximum intensity projections of selected confocal slices are shown in (c, d). Note the absence of intersegmental vessels (ISVs) and elongated GFP-positive skeletal muscle fibers (arrows, c, d). The embryos were obtained from an incross of heterozygous etv2ci32Gt carriers; embryo numbers (lower right) correspond to the expected Mendelian ratio. e Quantification of GFP+ myocytes in the trunk region of 8 etv2ci32Gt+/− and 10 etv2ci32Gt−/−; UAS:GFP embryos at 25 hpf, analyzed in 2 replicate experiments. The bars show median values. f–h Co-expression of etv2ci32Gt+/−; UAS:NTR-mCherry and muscle-specific actc1b:GFP in mCherry-positive muscle cells (arrows, g, h). i–k The Tg(etv2:mCherry) line shows mCherry expression in skeletal muscle cells when crossed to etv2ci32Gt+/−; UAS:GFP carriers. l, m Multiple GFP+ skeletal muscle cells are apparent in the progeny of etv2ci32Gt+/−; UAS:GFP zebrafish crossed with the etv2ci33+/− line, which carries a loss-of-function mutation in etv2. Note that the expected frequency of double heterozygous embryos in (m) is 50%. n Quantification of GFP+ myocytes in the trunk region of etv2ci32Gt/ci33 and etv2ci32Gt+/−; scl MO embryos shown in (m, p) obtained in two replicate experiments. The graphs show median and SD values. o GFP+ skeletal muscle cells observed in etv2y11−/− embryos crossed into the Tg(-2.3 etv2:GFP) reporter line. p Multiple GFP + skeletal muscle cells are apparent in etv2ci32Gt+/−; UAS:GFP embryos injected with scl MO. See graph n for quantification. q–s Ectopic myocytes observed in scl MO-injected etv2ci32Gt+/−; UAS:NTR-mCherry embryos are positive for muscle-specific actc1b:GFP expression at 24 hpf. tetv2 RNA overexpression inhibits myod expression (arrow). Dorsal view, anterior is to the left. u qPCR analysis of myf5, myod, and myog expression in etv2 RNA-injected and uninjected control embryos at the 10-somite stage. Mean values ± SEM is shown. RNA was purified from groups of ten embryos analyzed in two replicate experiments. In all graphs, two-tailed Student’s t test was used. The number of embryos displaying the representative phenotype out of the total number of embryos obtained from two replicate experiments is shown.
|