
FIGURE
Fig. 1
- ID
- ZDB-FIG-200513-13
- Publication
- Kara et al., 2019 - The miR-216a-Dot1l Regulatory Axis Is Necessary and Sufficient for Müller Glia Reprogramming during Retina Regeneration
- Other Figures
- All Figure Page
- Back to All Figure Page
Fig. 1
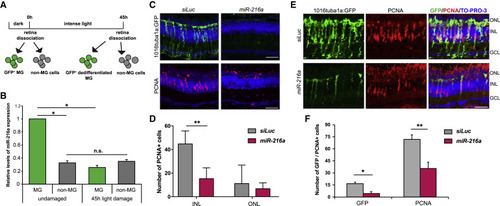
Suppression of miR-216a Is Required for MG Dedifferentiation and Proliferation during Retina Regeneration (A) Schematic for post-mitotic and dedifferentiated MG sorting. Adult zebrafish were dark adapted for 2 weeks and then exposed to constant intense light lesioning for 45 h. For post-mitotic MG isolation, GFP+cells were sorted from dark adapted Tg(gfap:gfp)retinas. For dedifferentiated MG isolation, GFP+ cells were isolated from 45 h light lesioned Tg(1016tuba1a:GFP)retinas. (B) Fold changes in miR-216a levels in FACS-purified MG were determined by qPCR. miR-216a is enriched in post-mitotic MG (GFP+) from undamaged retinas in Tg(gfap:gfp) fish. After 45 h of light damage, miR-216ais downregulated ∼5-fold in dedifferentiated MG (GFP+) in Tg(1016tuba1a:gfp) fish. miR-216a expression did not change in non-MG cells (GFP−) during regeneration. Data are from 5 independent experiments with 3 technical replicates of qPCR. MG were purified from 18 and 20 light-damaged fish in each experiment. Error bars represent the SEMs. ∗p < 0.05 and ∗∗p < 0.01 using 2-way ANOVA with Fisher’s least significant difference (LSD) post hoc test. (C) Control miRNA (siRNA against luciferase [siLuc]) or miR-216a was injected and electroporated into the left eyes of Tg(1016tuba1a:gfp) zebrafish before intense light exposure (0 h). After 45 h, retinas were collected, sectioned, and immunostained using antibodies against GFP and PCNA. Nuclei were counterstained with TOPRO (blue). miR-216again of function abolished tuba1a:GFP transgene expression and significantly reduced the number of INL PCNA+ proliferating cells. (D) Quantification of PCNA+ cells in the INL and ONL. Error bars represent the SEMs (n = 5–6 fish); ∗∗p < 0.01 using Student’s t test. (E) Overexpression of miR-216a reduced the number of GFP+/PCNA+proliferating progenitor cells after 60 h of intense light damage using Tg(1016tuba1a:gfp) zebrafish. (F) Quantification of total GFP+ and PCNA+ cells. Error bars represent the SEMs (n = 10 fish); ∗p < 0.03 and ∗∗p < 0.003 using Student’s t test. GCL, ganglion cell layer; INL, inner nuclear layer; ns, not significant; ONL, outer nuclear layer. Scale bars, 50 μm. |
Expression Data
Expression Detail
Antibody Labeling
Phenotype Data
Phenotype Detail
Acknowledgments
This image is the copyrighted work of the attributed author or publisher, and
ZFIN has permission only to display this image to its users.
Additional permissions should be obtained from the applicable author or publisher of the image.
Full text @ Cell Rep.