
Figure 5
- ID
- ZDB-FIG-200504-20
- Publication
- Schauer et al., 2020 - Zebrafish embryonic explants undergo genetically encoded self-assembly
- Other Figures
-
- Figure 1
- Figure 1—figure supplement 1
- Figure 1—figure supplement 2
- Figure 1—figure supplement 3.
- Figure 1—figure supplement 4
- Figure 2
- Figure 2—figure supplement 1
- Figure 2—figure supplement 2
- Figure 2—figure supplement 3
- Figure 3
- Figure 3—figure supplement 1
- Figure 4
- Figure 4—figure supplement 1
- Figure 4—figure supplement 2
- Figure 4—figure supplement 3
- Figure 5
- Figure 5—figure supplement 1
- Figure 6
- Figure 6—figure supplement 1
- All Figure Page
- Back to All Figure Page
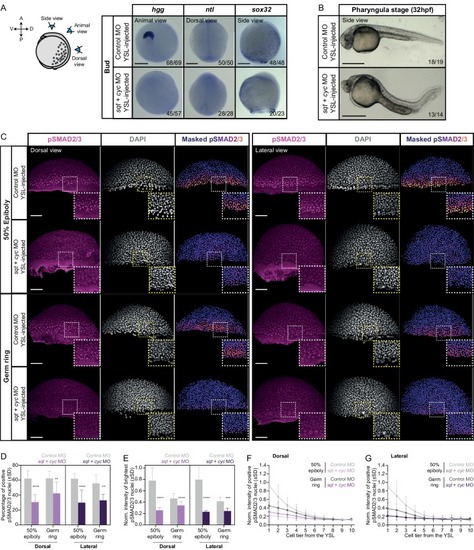
(A) Expression of mesendoderm (hgg and ntl) and endoderm (sox32) marker genes, as determined by whole mount in situ hybridization in control MO (6 ng) or sqt (2 ng) + cyc (4 ng) MO YSL-injected embryos at bud stage. Schematic representation of the embryo views is shown on the left. The proportion of embryos with a phenotype similar to the images shown is indicated in the lower right corner (hgg: control, n = 69, N = 4, sqt/cyc, n = 57, N = 4; ntl: control, n = 50,N = 4, sqt/cyc, n = 28, N = 4 and sox32: control, n = 48, N = 3, sqt/cyc, n = 23, N = 3). (B) Bright-field single-plane images of pharyngula stage (32 hpf) control MO (6 ng) or sqt (2 ng) + cyc (4 ng) MO YSL-injected embryos. The proportion of embryos with a phenotype similar to the images shown is indicated in the lower right corner (n = 19, N = 2; n = 14, N = 2). (C) High-resolution fluorescence images of control MO (6 ng) or sqt (2 ng) + cyc (4 ng) MO YSL-injected embryos stained both for pSMAD2/3 (pink) and DAPI (grey) at 50% epiboly (dorsal domain: control, n = 10, N = 4; sqt/cyc, n = 7, N = 4; lateral domain: control, n = 9, N = 4; sqt/cyc, n = 7, N = 4) and germ ring (dorsal domain: control, n = 7, N = 4; sqt/cyc, n = 8, N = 4; lateral domain: control, n = 8, N = 4; sqt/cyc, n = 7, N = 4). Nuclear pSMAD2/3 is color-coded using a fire lookup table (highest intensities in yellow) and was masked based on the DAPI signal. Insets are zoom-in images of the highlighted regions (dashed boxes). (D) Percentage of pSMAD2/3 positive nuclei in control MO (6 ng) or sqt (2 ng) + cyc (4 ng) MO YSL-injected embryos at 50% epiboly (dorsal domain: control, n = 10, N = 4; sqt/cyc, n = 7, N = 4; lateral domain: control, n = 9, N = 4; sqt/cyc, n = 7, N = 4) and germ ring (dorsal domain: control, n = 7, N = 4; sqt/cyc, n = 8, N = 4; lateral domain: control, n = 8, N = 4; sqt/cyc, n = 7, N = 4). ****p<0.0001, **p=0.0093, **p=0.0023, respectively (ANOVA test). (E) Normalized intensity of the brightest pSMAD2/3 positive nuclei (for details see Materials and methods) in control MO (6 ng) or sqt (2 ng) + cyc (4 ng) MO YSL-injected embryos at 50% epiboly (dorsal domain: control, n = 10, N = 4; sqt/cyc, n = 7, N = 4; lateral domain: control, n = 9, N = 4; sqt/cyc, n = 7, N = 4) and germ ring (dorsal domain: control, n = 7, N = 4; sqt/cyc, n = 8, N = 4; lateral domain: control, n = 8, N = 4; sqt/cyc, n = 7, N = 4). ****p<0.0001, ***p=0.0010 (Kruskal-Wallis test). (F,G) Normalized intensity of the brightest pSMAD2/3 positive nuclei as a function of the distance to the YSL, expressed as cell tiers, in control MO (6 ng) or sqt (2 ng) + cyc (4 ng) MO YSL-injected embryos at 50% epiboly (for details see Materials and methods; dorsal domain: control, n = 10, N = 4; sqt/cyc, n = 7, N = 4; lateral domain: control, n = 9, N = 4; sqt/cyc, n = 7, N = 4) and germ ring (dorsal domain: control, n = 7, N = 4; sqt/cyc, n = 8, N = 4; lateral domain: control, n = 8, N = 4; sqt/cyc, n = 7, N = 4). (C-G) The position along the dorsal-ventral axis is indicated at the top. Scale bars: 200 µm (A), 500 µm (B), 100 µm (C). |