Figure 1—figure supplement 4

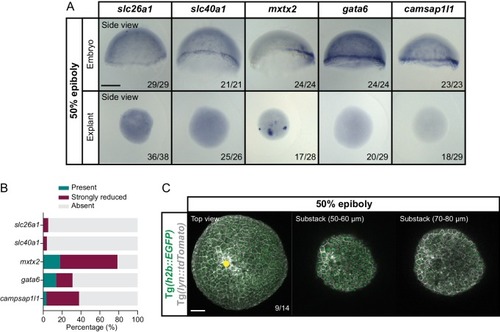
Blastoderm explants exhibit reduced or no YSL features.

(A) Expression of YSL marker genes (slc26a1, slc40a1, mxtx2, gata6 and camsap1l1) in stage-matched embryos (side view) and blastoderm explants (side view), as determined by whole mount in situ hybridization at 50% epiboly. The proportion of embryos or blastoderm explants with a phenotype similar to the images shown is indicated in the lower right corner (slc26a1: embryos, n = 29, N = 3, explants, n = 38, N = 3; slc40a1: embryos, n = 21, N = 3, explants, n = 26, N = 3; mxtx2: embryos, n = 24, N = 4, explants, n = 28, N = 4; gata6: embryos, n = 24, N = 3, explants, n = 29, N = 3; camsap1l1: embryos, n = 23, N = 3, explants, n = 29, N = 3). (B) Percentage of blastoderm explants showing normal, strongly reduced or no expression of YSL marker genes (slc26a1: n = 38, N = 3; slc40a1: n = 26, N = 3; mxtx2: n = 28, N = 4; gata6: n = 29, N = 3; camsap1l1: n = 29, N = 3) as determined by whole mount in situ hybridization at 50% epiboly. (C) High-resolution fluorescence images of a blastoderm explant at 50% epiboly (top views shown at different optical sections). Cell membranes (grey) are marked by lyn::tdTomato and nuclei (green) by h2b::EGFP. The proportion of blastoderm explants with a phenotype similar to the images shown is indicated in the lower right corner (n = 14, N = 3). Yellow circle denotes the wounding site. Scale bars: 200 µm (A), 100 µm (C).

Blastoderm explants exhibit reduced or no expression of YSL markers.

Expression Data

Expression Detail
Antibody Labeling
Phenotype Data

Phenotype Detail
Acknowledgments
This image is the copyrighted work of the attributed author or publisher, and ZFIN has permission only to display this image to its users. Additional permissions should be obtained from the applicable author or publisher of the image. Full text @ Elife