
Figure 5
- ID
- ZDB-IMAGE-200504-7
- Publication
- Schauer et al., 2020 - Zebrafish embryonic explants undergo genetically encoded self-assembly
- All Figures
- Figures for Schauer et al., 2020
|
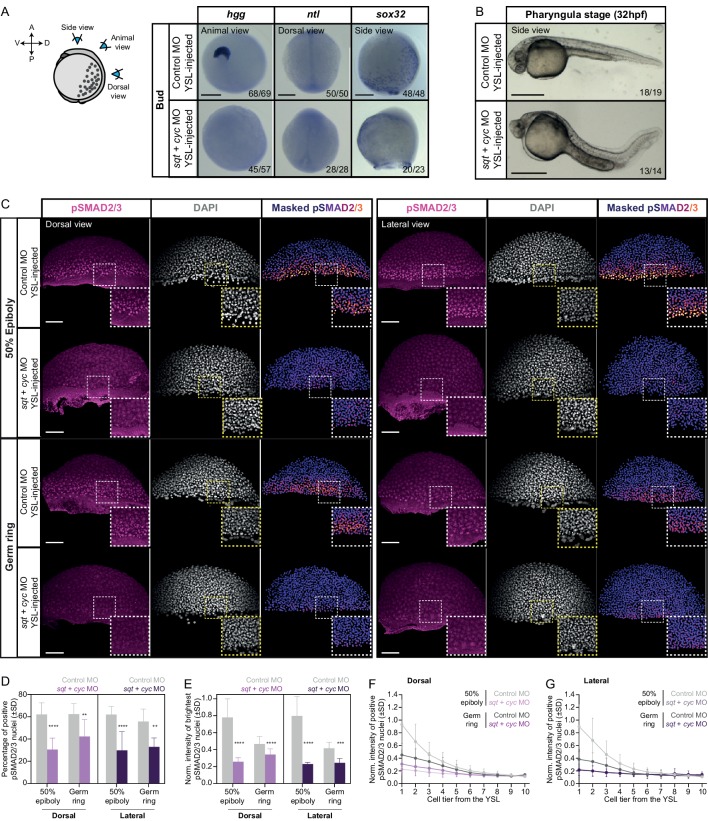
Figure 5 (A) Expression of mesendoderm (hgg and ntl) and endoderm (sox32) marker genes, as determined by whole mount in situ hybridization in control MO (6 ng) or sqt (2 ng) + cyc (4 ng) MO YSL-injected embryos at bud stage. Schematic representation of the embryo views is shown on the left. The proportion of embryos with a phenotype similar to the images shown is indicated in the lower right corner (hgg: control, n = 69, N = 4, sqt/cyc, n = 57, N = 4; ntl: control, n = 50,N = 4, sqt/cyc, n = 28, N = 4 and sox32: control, n = 48, N = 3, sqt/cyc, n = 23, N = 3). (B) Bright-field single-plane images of pharyngula stage (32 hpf) control MO (6 ng) or sqt (2 ng) + cyc (4 ng) MO YSL-injected embryos. The proportion of embryos with a phenotype similar to the images shown is indicated in the lower right corner (n = 19, N = 2; n = 14, N = 2). (C) High-resolution fluorescence images of control MO (6 ng) or sqt (2 ng) + cyc (4 ng) MO YSL-injected embryos stained both for pSMAD2/3 (pink) and DAPI (grey) at 50% epiboly (dorsal domain: control, n = 10, N = 4; sqt/cyc, n = 7, N = 4; lateral domain: control, n = 9, N = 4; sqt/cyc, n = 7, N = 4) and germ ring (dorsal domain: control, n = 7, N = 4; sqt/cyc, n = 8, N = 4; lateral domain: control, n = 8, N = 4; sqt/cyc, n = 7, N = 4). Nuclear pSMAD2/3 is color-coded using a fire lookup table (highest intensities in yellow) and was masked based on the DAPI signal. Insets are zoom-in images of the highlighted regions (dashed boxes). (D) Percentage of pSMAD2/3 positive nuclei in control MO (6 ng) or sqt (2 ng) + cyc (4 ng) MO YSL-injected embryos at 50% epiboly (dorsal domain: control, n = 10, N = 4; sqt/cyc, n = 7, N = 4; lateral domain: control, n = 9, N = 4; sqt/cyc, n = 7, N = 4) and germ ring (dorsal domain: control, n = 7, N = 4; sqt/cyc, n = 8, N = 4; lateral domain: control, n = 8, N = 4; sqt/cyc, n = 7, N = 4). ****p<0.0001, **p=0.0093, **p=0.0023, respectively (ANOVA test). (E) Normalized intensity of the brightest pSMAD2/3 positive nuclei (for details see Materials and methods) in control MO (6 ng) or sqt (2 ng) + cyc (4 ng) MO YSL-injected embryos at 50% epiboly (dorsal domain: control, n = 10, N = 4; sqt/cyc, n = 7, N = 4; lateral domain: control, n = 9, N = 4; sqt/cyc, n = 7, N = 4) and germ ring (dorsal domain: control, n = 7, N = 4; sqt/cyc, n = 8, N = 4; lateral domain: control, n = 8, N = 4; sqt/cyc, n = 7, N = 4). ****p<0.0001, ***p=0.0010 (Kruskal-Wallis test). (F,G) Normalized intensity of the brightest pSMAD2/3 positive nuclei as a function of the distance to the YSL, expressed as cell tiers, in control MO (6 ng) or sqt (2 ng) + cyc (4 ng) MO YSL-injected embryos at 50% epiboly (for details see Materials and methods; dorsal domain: control, n = 10, N = 4; sqt/cyc, n = 7, N = 4; lateral domain: control, n = 9, N = 4; sqt/cyc, n = 7, N = 4) and germ ring (dorsal domain: control, n = 7, N = 4; sqt/cyc, n = 8, N = 4; lateral domain: control, n = 8, N = 4; sqt/cyc, n = 7, N = 4). (C-G) The position along the dorsal-ventral axis is indicated at the top. Scale bars: 200 µm (A), 500 µm (B), 100 µm (C).