|
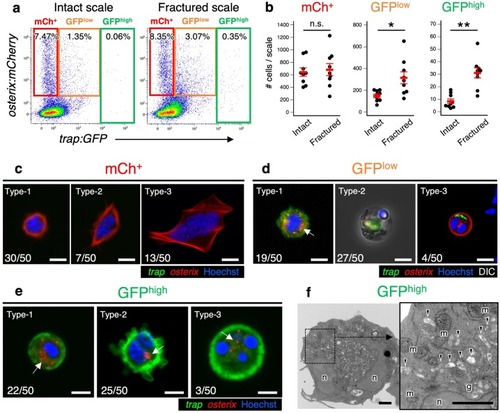
OCs contain <italic>osterix:mCherry</italic><sup>+</sup> particles.a Representative results of flow cytometric analysis of cells from intact (left panel) or fractured scales at 1 day post-fracture (dpf) (right panel). Red, orange, and green gate show trap:GFP–osterix:mCherry+ (“mCh+”), trap:GFPlowosterix:mCherry+ (“GFPlow”), and trap:GFPhigh (“GFPhigh”) cells, respectively. b Absolute number of mCh+, GFPlow, and GFPhigh cells in an intact or fractured scale at 1 dpf. Error bars, s.e.m. (n = 9 for each group); n.s., no significance; *p < 0.05; **p < 0.001 by Student’s t-test. c–e Representative fluorescent images of mCh+c, GFPlowd, and GFPhigh cells e. Arrows indicate an osterix:mCherry+ particle observed in the cytoplasm. Numbers in bottom left of panels indicate the number of cells showing the displayed morphology over the total number of analyzed cells. DIC differential interference contrast. f Representative electron microscopic images of a GFPhigh cell. Arrowheads show vesicles, which include secondary lysosomes, early endosomes, and multi-vesicular bodies. n nucleus; m mitochondrion; g Golgi apparatus; bars, 5 μm c–e; 1 μm f. Experiments were performed twice with nine biological replicates a, b and two biological replicates c–f in each group.
|