FIGURE SUMMARY
Title

Uptake of osteoblast-derived extracellular vesicles promotes the differentiation of osteoclasts in the zebrafish scale

Authors
Kobayashi-Sun, J., Yamamori, S., Kondo, M., Kuroda, J., Ikegame, M., Suzuki, N., Kitamura, K.I., Hattori, A., Yamaguchi, M., Kobayashi, I.
Source
Full text @ Commun Biol

<italic>trap:GFP</italic><sup>+</sup> cells converged at the fracture site in the zebrafish scale.

a, b Representative images of an intact a or fractured scale b in trap:GFP; osterix:mCherry double-transgenic zebrafish. Dotted lines in a show a boundary of the dermis (der) and epidermis (epd) area. The right panel in b shows a high magnification view of the white boxed area in the left panel. c Representative time-course changes of a fractured scale. The inset in the left panel shows a high magnification view of the blue boxed area. Images are orientated with the dorsal side to the top and anterior side to the left. Arrows indicate trap:GFP+ cells observed in the edge area of the fractured scale. Dotted lines in b and c show the fracture site. DIC differential interference contrast. Hoe Hoechst 33342; dpf days post-fracture; bars, 200 μm a; 10 μm (right panel in b); 100 μm (left panel in b, c). Experiments were performed twice with three biological replicates in each group ac.

OCs contain <italic>osterix:mCherry</italic><sup>+</sup> particles.

a Representative results of flow cytometric analysis of cells from intact (left panel) or fractured scales at 1 day post-fracture (dpf) (right panel). Red, orange, and green gate show trap:GFPosterix:mCherry+ (“mCh+”), trap:GFPlowosterix:mCherry+ (“GFPlow”), and trap:GFPhigh (“GFPhigh”) cells, respectively. b Absolute number of mCh+, GFPlow, and GFPhigh cells in an intact or fractured scale at 1 dpf. Error bars, s.e.m. (n = 9 for each group); n.s., no significance; *p < 0.05; **p < 0.001 by Student’s t-test. ce Representative fluorescent images of mCh+c, GFPlowd, and GFPhigh cells e. Arrows indicate an osterix:mCherry+ particle observed in the cytoplasm. Numbers in bottom left of panels indicate the number of cells showing the displayed morphology over the total number of analyzed cells. DIC differential interference contrast. f Representative electron microscopic images of a GFPhigh cell. Arrowheads show vesicles, which include secondary lysosomes, early endosomes, and multi-vesicular bodies. n nucleus; m mitochondrion; g Golgi apparatus; bars, 5 μm ce; 1 μm f. Experiments were performed twice with nine biological replicates a, b and two biological replicates cf in each group.

Transplantation assays confirm uptake of OB-derived EVs in OCs.

a Schematic diagram of transplantation assays. Hematopoietic cells from trap:GFP; osterix:mCherry double-transgenic zebrafish kidney were transplanted into wild type recipients irradiated with sublethal dose of X-ray (Transplantation-1, n = 3). Hematopoietic cells from trap:GFP single-transgenic zebrafish kidney were transplanted into osterix:mCherry single-transgenic recipients (Transplantation-2, n = 4). After 20 or 8 weeks post-transplantation, cells in scales at 1 day post-fracture (dpf) were analyzed by flow cytometry (FCM) and/or confocal microscopy. b Representative results of FCM analysis in fractured scales from a recipient in Transplantation-1 (left) and recipient in Transplantation-2 (midle). Red, orange, and green gate show trap:GFPosterix:mCherry+ (“mCh+”), trap:GFPlowosterix:mCherry+ (“GFPlow”), and trap:GFPhigh (“GFPhigh”) cells, respectively. GFPhigh cells in a recipient of Transplantation-2 are displayed in an osterix:mCherry vs. side scatter (SSC) dot plot (right panel). c Representative images of a fractured scale from a trap:GFP; osterix:mCherry double-transgenic animal (left) and recipient in Transplantation-1 (right). Dotted lines indicate the fracture site. Both images showed merged channels of GFP and mCherry. Bars, 100 μm. Experiments were performed twice with three or four biological replicates in each group.

<italic>trap:GFP</italic><sup>+</sup> OCs engulf OB-derived EVs.

a Representative time-lapse imaging of the fractured scale in a trap:GFP; osterix:mCherry double-transgenic animal. Six sequences from Supplementary Movie 6 are presented, documenting the stepwise engulfment of OB-derived EVs (arrowheads) by a trap:GFP+ cell (arrows). b Single plane of a z-stack of a trap:GFP+ cell at the time point of 39 min. Images show a green (trap:GFP), red (osterix:mCherry), and merged channel. Bars, 10 μm. Experiments were performed six times with similar results.

Isolation of OB-derived EVs.

a Representative flow cytometric analysis of cells in fractured scales at 1 day post-fracture (dpf) from an osterix:mCherry single-transgenic zebrafish. Gated regions in the left panel indicate the osterix:mCherry+ Hoecht 33342high (mCh+ Hoehigh) cell fraction and mCh+ Hoelow EV fraction. mCh+ Hoehigh cells and mCh+ Hoelow EVs are displayed in a forward scatter (FSC) vs. side scatter (SSC) dot plot (middle and right panels, respectively). b Representative electron microscopic images of isolated large and small EVs. c Representative image of isolated EVs negatively stained. Arrows indicate an EV. d Percent size distribution of EVs (n = 223). e Absolute number of mCh+ Hoelow EVs in an intact and fractured scale at 1 dpf. **p < 0.01 (n = 9 for each group). Bars, 1 μm b; 2 μm c. Experiments were performed twice with two biological replicates ad and nine biological replicates e in each group.

Transcriptome analysis of OBs, OCs, and OB-derived EVs.

a Representative flow cytometric analysis of cells in scales at 1 day post-fracture (dpf) from a trap:GFP; osterix:mCherry double-transgenic animal. Gated regions in the left panel indicate the Hoechst 33342high (Hoehigh) cell fraction and osterix:mCherry+ Hoelow fraction (“EV”). Cells in the Hoehigh fraction are displayed in the right panel to further divide into three populations, trap:GFPosterix:mCherry+ (“mCh+”), trap:GFPlowosterix:mCherry+ (“GFPlow”), and trap:GFPhigh (“GFPhigh”). b Principal component analysis (PCA) based on the read per million (RPM) of each sample. c, d Hierarchical clustering of selected OC-related c and OB-related genes d in the mCh+, GFPlow, GFPhigh, and EV fraction in the fractured scale. e Gene ontology enrichment analysis of highly expressed genes in the mCh+, GFPlow, GFPhigh, and EV fraction. Experiments were performed once with two biological replicates.

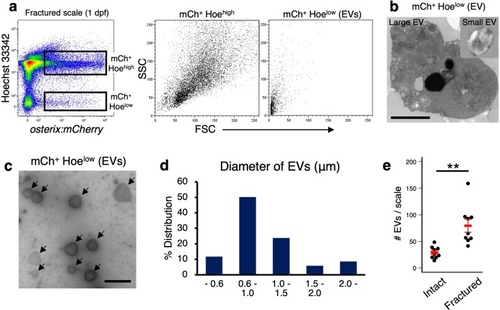
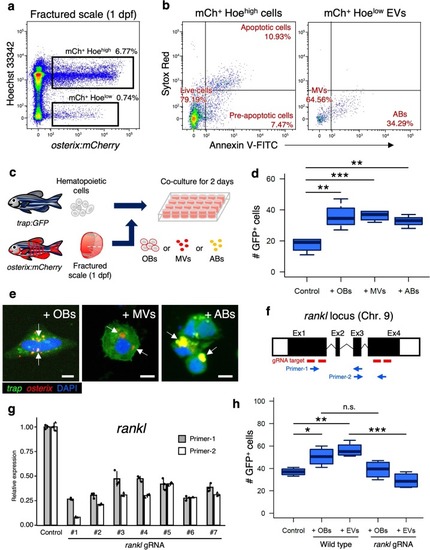
OB-derived EVs promote OC differentiation via Rankl signaling.

a Representative flow cytometric analysis of cells in scales at 1 day post-fracture (dpf) from a osterix:mCherry single-transgenic animal. Gated regions indicate the mCh+ Hoehigh cell fraction and mCh+ Hoelow EV fraction. b mCh+ Hoehigh cells and mCh+ Hoelow EVs were displayed in an Annexin-V-FITC vs. Sytox Red dot plot. mCh+ Hoehigh cells were subdivided into three fractions, “live”, “pre-apoptotic”, and “apoptotic”, whereas mCh+ Hoelow EVs were divided into two fractions, “microvesicle” (MV) and “apoptotic body” (AB). c Schematic diagram of in vitro cell culture assays. Kidney marrow cells (KMCs) from trap:GFP single-transgenic zebrafish were co-cultured with OBs, MVs, or ABs from fractured scales of osterix:mCherry single-transgenic zebrafish in a fibronectin-coated plate. At 2 days of co-culture, the number of trap:GFP+ cells was counted in each well. Non-co-cultured KMCs were used as a control. d The average number of trap:GFP+ cells in each type of wells. Error bars, s.d. (n = 4 for each group). e Representative images of trap:GFP+ cells co-cultured with OBs (left panel), MVs (middle panel), or ABs (right panel). trap:GFP+ cells contained OB-derived EVs in the cytoplasm (arrows). Bars, 5 μm. f Schematic diagram of zebrafish rankl locus. gRNA target sites and primer recognition sites are shown in red bars and blue arrows, respectively. g qPCR analysis of rankl in the adult fin of wild type control and rankl gRNA-injected animals. Results from seven individual gRNA-injected animals are shown. Data are mean ± s.d. from three independent experiments. h The average number of trap:GFP+ cells in non-co-cultured KMCs (control), or KMCs co-cultured with OBs or EVs from wild type or rankl gRNA-injected animals. Error bars, s.d. (n = 4 for each group); n.s., no significance; *p < 0.05; **p < 0.01; ***p < 0.001 by one-way ANOVA followed by Dunnett’s test. Experiments were performed twice with four biological replicates in each group d, h.

Acknowledgments
This image is the copyrighted work of the attributed author or publisher, and ZFIN has permission only to display this image to its users. Additional permissions should be obtained from the applicable author or publisher of the image. Full text @ Commun Biol