|
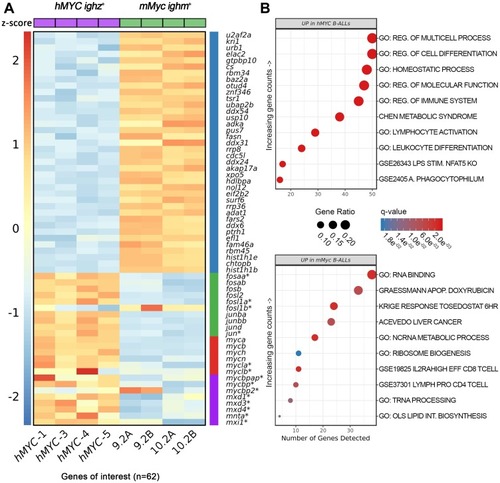
Differentially-expressed genes in <italic>hMYC</italic> versus <italic>mMyc</italic> B-ALL.(A) Heatmap depicting 62 differentially-expressed mRNA, including genes of the Gene Ontology (GO) RNA binding pathway (blue bar), D. rerio fos/jun-family members (green bar), endogenous myc-family members (red bar), and other myc-related proteins, including several max heterodimeric partners (purple bar). Samples hMYC-1, -3, -4, and -5 are four distinct hMYC B-ALL; 9.2A/B and 10.2A/B pairs are RNA-seq technical replicates of two mMyc B-ALL [57, 60]. Genes not meeting differential expression testing thresholds or other filtering criteria are marked by asterisks (FDR < 0.05, absolute fold-change ≥ 1.5). Read counts are shown as z-scores (scale bar at left). (B) Top ten biologic pathways up-regulated in hMYC (top) or mMyc B-ALL (bottom; FDR < 0.05). Pathways are ordered according to the number of genes detected in the gene set (x-axis) and colored based on FDR q-value. Data point sizes correspond to the percentage of genes over-expressed in each pathway.
|