FIGURE

Figure 4

ID
ZDB-FIG-200430-3
Publication
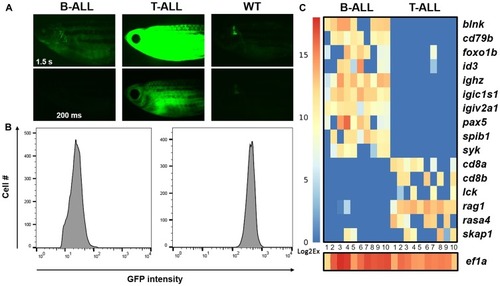
Park et al., 2020 - Zebrafish B cell acute lymphoblastic leukemia: new findings in an old model
Other Figures
All Figure Page
Back to All Figure Page
Figure 4

Gene expression in individual <italic>hMYC</italic> B- and T-ALL cells.

(A) rag2:hMYC;lck: GFP fish with dim (left) and bright (center) cancers. B-ALL is only visible with 1.5 s exposure (upper left); T-ALL is visible with either 1.5 s (upper middle) or 200 ms (lower middle) exposures. Control lck:GFP fish images are shown at right, where only the thymus is visible. (B) Flow cytometry plots of the same ALL samples demonstrate GFPlo B-ALL and GFPhi T-ALL specimens. (C) Gene expression in single B- and T-ALL cells of the same cancers (n = 10 cells for each), as determined by Fluidigm™ Biomark qRT-PCR. B-ALL cells express B cell, but not T cell, genes; T-ALL show the opposite pattern. Expression of eef1a1l1 (homologue of human eukaryotic translation elongation factor 1 alpha 1, aka EF1A) was used as a threshold control for the presence of RNA in each well. CT values were converted to Log2Ex for visualization (scale bar at left).

Expression Data

Expression Detail
Antibody Labeling
Phenotype Data

Phenotype Detail
Acknowledgments
This image is the copyrighted work of the attributed author or publisher, and ZFIN has permission only to display this image to its users. Additional permissions should be obtained from the applicable author or publisher of the image. Full text @ Oncotarget