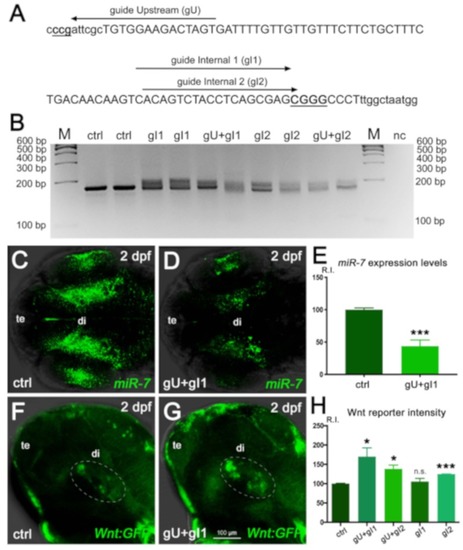
miR-7 gene editing decreases miR-7 expression and increases Wnt signaling in the zebrafish diencephalon. (A) Position of the three Crispr/Cas9 guides used to perform gene editing in the zebrafish miR-7a locus. (B) Agarose gel electrophoretic analysis of the Crispr/Cas9-targeted region in the miR-7a gene, PCR-amplified from genomic DNA of control (ctrl) or guide-injected (g) embryos. Smears indicate Crispr/Cas9-induced gene modification. M: size marker; nc: PCR negative control. (C–E) Decreased miR-7 expression is observed in crispants injected with the gU + gI1 Crispr/Cas9 guides, compared with the control (ctrl). Signal quantification (R.I.: relative intensity) is shown in E; (***), p < 0.001, n = 6. (F–H) Analysis of diencephalic Wnt signaling (green cells within the white dashed ellipse) in the control (ctrl, F) and guide-injected (gU + gI1, G) Wnt:GFP transgenic embryos (G). Signal quantification is shown in (H). The highest Wnt signal increase (80% more than the control level) is reached with the gU + gI1 guide combination; (*) p < 0.05 and (***) p < 0001; (n.s.), not significant; n = 6. All embryonic heads are at 2 dpf and in dorsal (C,D) or lateral (F,G) view, with anterior to the left. te: telencephalon; di: diencephalon.
|
