|
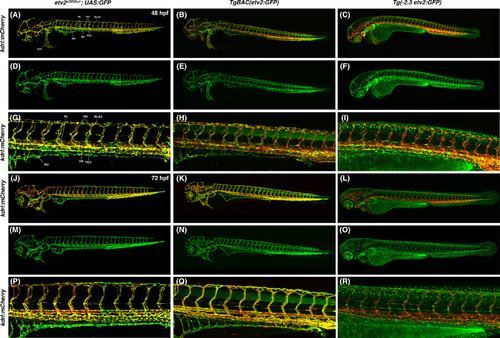
A comparison of etv2 ci32Gt+/−; UAS:GFP, TgBAC(etv2:GFP), Tg(−2.3etv2:GFP) fluorescence pattern (in kdrl:mCherry background) at 48 hpf, A‐I, and 72 hpf, J‐R. etv2 ci32Gt+/−; UAS:GFP expression is apparent throughout the entire vasculature and in lymphatic progenitors (parachordal lymphangioblasts, PLs). TgBAC(etv2:GFP) shows similar expression pattern, and also shows nonspecific expression in the neural tube. Vascular endothelial expression in Tg(−2.3etv2:GFP) line is downregulated after 48 hpf and is very weak at 72 hpf, while nonspecific epithelial expression is apparent. A‐C, J‐L, Merged mCherry and GFP channels; D‐F, M‐O, GFP channel; G‐I, P‐R, magnified images of the trunk region in, A‐C, J‐L. DA, dorsal aorta; PCV, posterior cardinal vein; ISV, intersegmental vessels, SIV, subintestinal vessel; DLAV, dorsal longitudinal anastomotic vessel; CCV, common cardinal vein
|