
FIGURE
Fig. 6
- ID
- ZDB-FIG-200413-50
- Publication
- Chestnut et al., 2019 - Zebrafish etv2 knock-in line labels vascular endothelial and blood progenitor cells
- Other Figures
- All Figure Page
- Back to All Figure Page
Fig. 6
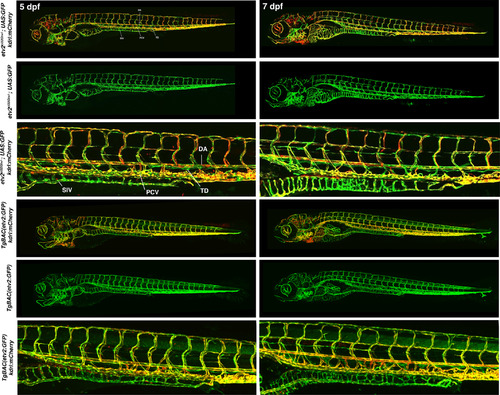
A comparison of etv2 ci32Gt+/−; UAS:GFP and TgBAC(etv2:GFP) embryos in kdrl:mCherry background at 5 and 7 dpf. Both lines show GFP expression in the entire vasculature and lymphatics. DA, dorsal aorta; PCV, posterior cardinal vein; SIV, subintestinal vein (thoracic duct, TD). Tg (−2.3etv2:GFP) line did not show vascular endothelial expression at these stages |
Expression Data
| Genes: | |
|---|---|
| Fish: | |
| Anatomical Terms: | |
| Stage Range: | Day 5 to Days 7-13 |
Expression Detail
Antibody Labeling
Phenotype Data
Phenotype Detail
Acknowledgments
This image is the copyrighted work of the attributed author or publisher, and
ZFIN has permission only to display this image to its users.
Additional permissions should be obtained from the applicable author or publisher of the image.
Full text @ Dev. Dyn.