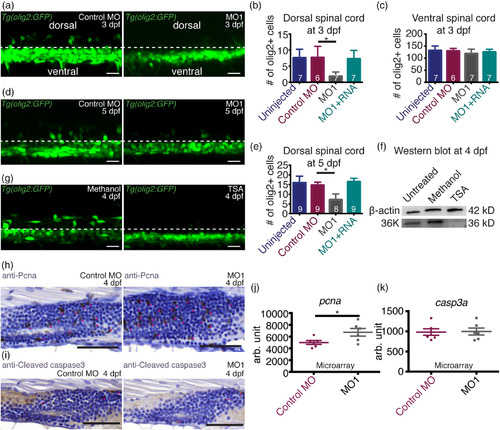
36K knockdown zfl have fewer dorsally migrated OPCs. (a) Representative image depicting lateral view of two spinal segments above the yolk extension at 3 dpf in Tg(olig2:GFP) zfl injected with control MO and MO1 showing dorsal and ventral spinal cord regions with a separation by dotted lines. (b,c) Number of olig2+ cells in two spinal segments (b) in the dorsal spinal cord and (c) in the ventral spinal cord. N = 3; n shown in each bar. For (b), Kruskal–Wallis ANOVA p ≤ .01 (**) followed by Dunn's multiple comparisons test for control MO versus MO1. For (c), Kruskal–Wallis ANOVA p > .05 (not significant). (d) Representative image depicting lateral view of two spinal segments above the yolk extension at 5 dpf in Tg(olig2:GFP) zfl injected with control MO and MO1. (e) Number of olig2 positive cells in two spinal segments in the dorsal spinal cord. N = 3; n shown in each bar. Kruskal–Wallis ANOVA p ≤ .0001 (***) followed by Dunn's multiple comparisons test for control MO versus MO1. (f) Western blot against 36K using untreated, methanol (control) and TSA treated whole larvae at 4 dpf with β‐actin as loading control. There was no 36K band detectable in the TSA treated zfl. (g) Representative lateral view of two spinal segments above the yolk extension at 4 dpf in Tg(olig2:GFP) zfl treated with methanol (control) or TSA. There were no dorsally migrated OPCs detectable in the TSA treated zfl. (h) Representative images of sagittal paraffin sections of 4 dpf larvae injected with control MO and MO1 showing proliferation within the spinal cord labeled with anti‐Pcna. Sections were counter stained with hematoxylin. Proliferating cells are marked by pink stars. There were more proliferating cells in the spinal cord of MO1 zfl compared to control MO. Scale bars: 50 μm. (i) Representative images of sagittal views of paraffin sections of 4 dpf larvae injected with control MO and MO1 showing apoptotic cells within the spinal cord labeled with anti‐Cleaved caspase 3. Sections were counter stained with hematoxylin. Apoptotic cells are marked by pink stars, no difference could be seen between MO1 and control MO zfl. Scale bars: 50 μm. (j,k) Expression of (j) pcna and (k) casp3a in control MO and MO1 at 3 dpf from microarray analysis. N = 6. Unpaired two tailed t test with Welch's correction. p‐value .0450 (*) for pcna (j), p‐value .9045 (not significant) for casp3a (k)
|
