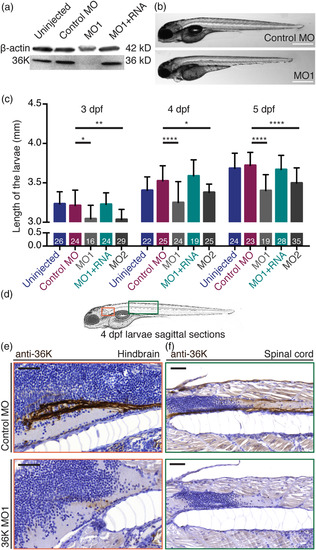
Translation blocking MOs specifically knock down 36K protein expression. (a) Anti‐36K Western blot on whole larvae tissue showing 36K MO1 knockdown and rescue at 4 dpf. (b) Lateral view of control MO and MO1 injected zfl at 4 dpf. Scale bars: 500 μm. (c) Reduction in body length of the MO larvae at 3, 4, and 5 dpf. Sample sizes: N = 3; n shown in each bar. Two way ANOVA p ≤ .0001 (****) followed by Tukey's multiple comparisons test for control MO versus MO1 and control MO versus MO2. MO1 versus MO1 + RNA was always significantly different (not shown). Control MO versus MO1 + RNA was not significant at any of the three time‐points (p > .05). (d) Zebrafish overview sketch highlighting different CNS regions: shown as red box (e, hindbrain) and as green box (f, spinal cord). (e,f) Comparable sagittal paraffin sections counter stained with hematoxylin depicting anti‐36K staining in the hindbrain (e) and spinal cord (f) at 4 dpf in control MO (top; intense staining) and MO1 (bottom; reduced/weak staining) zfl. Scale bars: 50 μm
|
