
Figure 6-S1
- ID
- ZDB-FIG-200406-265
- Publication
- Xie et al., 2020 - Chemoptogenetic ablation of neuronal mitochondria in vivo with spatiotemporal precision and controllable severity
- Other Figures
- All Figure Page
- Back to All Figure Page
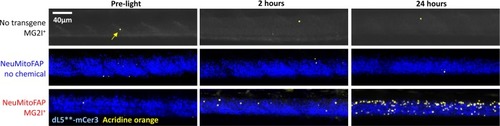
Delayed CNS cell death in NeuMitoFAP zebrafish exposed to MG2I and far-red light.Similar micrographs are shown as in Figure 6C, and quantified in Figure 6D, but including the control groups in comparison with NeuMitoFAP-MG2I larvae, before exposure, 2 hr after, and 24 hr after exposure to 60 J/cm2 far-red light at λpeak=661 nm. Segments of the spinal cord of live anesthetized zebrafish larvae were imaged using confocal microscopy for mCerulean3 (pseudocolored blue) and Acridine Orange (pseudocolored yellow). Under the zebrafish eno2 promoter element (Bai et al., 2007), the dL5**-mCerulean3 fusion protein is expressed in the mitochondria of most neurons in NeuMitoFAP zebrafish, so the spinal cord is outlined by the mCerulean3 fluorescence signal, providing a convenient anatomical landmark. There is no mCerulean3 signal in non-transgenic zebrafish (top row). The number of Acridine Orange-labeled cells in the spinal cord increased dramatically in NeuMitoFAP-MG2I zebrafish, but not controls, following exposure to far-red light (see Figure 6D for quantification and statistical analysis). |