
Figure 3
- ID
- ZDB-FIG-200406-256
- Publication
- Xie et al., 2020 - Chemoptogenetic ablation of neuronal mitochondria in vivo with spatiotemporal precision and controllable severity
- Other Figures
- All Figure Page
- Back to All Figure Page
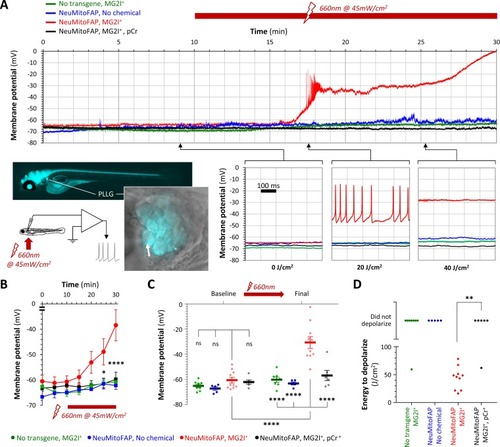
Acute neuronal depolarization in NeuMitoFAP zebrafish exposed to MG2I and far-red light.(A) Whole-cell patch clamp recordings were made from posterior lateral line ganglion (PLLG) sensory neurons. The inset figure shows the preparation and experimental design (the arrow shows a patch-clamp pipette in contact with a mitoFAP-expressing neuron). Recordings were made for 30–40 min (10 min in darkness and then a further 20–30 min under illumination in far-red light at λpeak=661 nm). The graphs show example traces of membrane potential (y-axis) against time (x-axis), for the full 30 min recording (upper graph) and for three 500 ms sweeps after cumulative far-red light doses of 0, 20 or 40 J/cm2 as indicated. Experimental groups: WT zebrafish exposed to MG2I (green); NeuMitoFAP zebrafish (blue); NeuMitoFAP zebrafish exposed to MG2I (red); NeuMitoFAP zebrafish exposed to MG2I, recordings made with phosphocreatine (pCr) added to pipette solution (black). (B) Mean ± SE membrane potential (y-axis; 5–10 neurons per group) in each 5 min time bin (x-axis) during recording. *p<0.05, ****p<0.0001, NeuMitoFAP-MG2I versus other groups at same time point, 2-way repeated measures ANOVA with Tukey multiple comparisons test. (C) Membrane potential of lateral line ganglion neurons (y-axis) at baseline and final potential after far-red light exposure. Data points show individual neurons, bars show mean ± SE. ****p<0.0001, 1-way ANOVA with Tukey multiple comparison test. (D) Amount of far-red light energy necessary to decrease membrane potential by >20% from baseline value (y-axis). Data points show individual neurons. Neurons that did not depolarize during the recording period are shown above the graph. **p<0.01, Fisher’s exact test. |