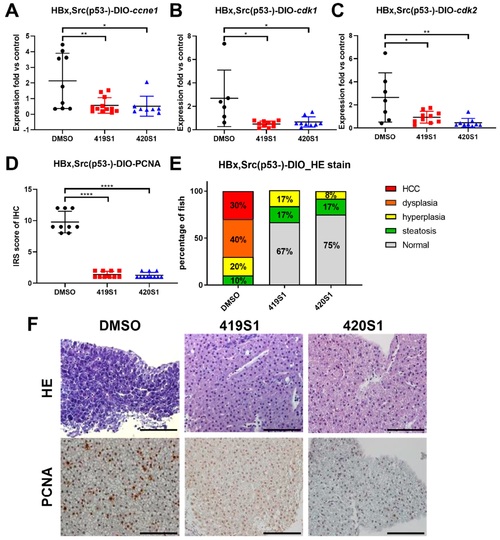
The treatment of 419S1 and 420S1 blocked HCC formation in Tg(fabp10a:HBx,src, p53−) transgenic zebrafish. (A–C) Dot-plot of relative expression fold of cell-cycle-related genes ccne1, cdk1, and cdk2 after 419S1 and 420S1 oral gavage for one month in Tg(fabp10a:HBx,src, p53−) compared to control fish. DMSO-treated Tg(fabp10a:HBx,src, p53−) fish exhibited high levels of ccne1, cdk1, and cdk2 expression compared to control fish. DMSO- (black circle), 419S1- (red square), and 420S1 (blue triangle)-treated Tg(fabp10a:HBx,src, p53−) fish showed significantly decreased ccne1, cdk1, and cdk2 expression compared to DMSO. (D) Dot-plot of relative expression fold of immunoreactive score (IRS), which was obtained by multiplying the intensity grade by the percentage rating from PCNA IHC stain. (E) Percentage of fish with various histopathological features revealed by H&E stain after different drug treatments for one month. Red indicates HCC, orange denotes dysplasia, yellow represents hyperplasia, green denotes steatosis, and grey is normal hepatocyte. (F) Representative images of H&E stain (400 ×) and PCNA IHC staining after 419S1 and 420S1 oral gavage for one month in Tg(fabp10a:HBx,src, p53−) compared to DMSO control. Scare bar: 100 μm. *: 0.01 < p ≤ 0.05; **: 0.001 < p ≤ 0.01; ****: p ≤ 0.0001
|
