
Fig. 3-S1
- ID
- ZDB-FIG-200325-18
- Publication
- Wee et al., 2019 - A bidirectional network for appetite control in larval zebrafish
- Other Figures
- All Figure Page
- Back to All Figure Page
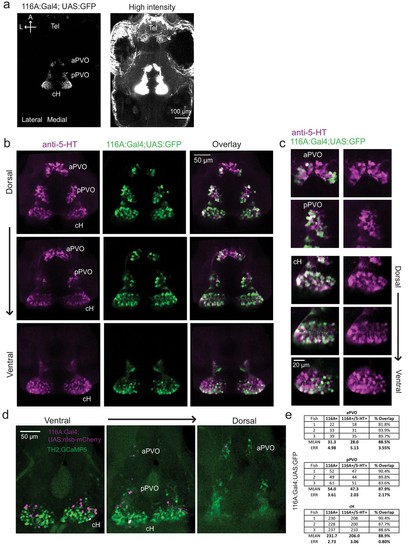
Characterization of the 116A:Gal4 line.( a) Z-projection images of whole mount Tg(116A:Gal4;UAS:GFP) fish at low (left) and high (right) intensities. Scale bar = 100 μm. ( b) Overlap of Tg(116A:Gal4;UAS:GFP) (green) with anti-5-HT (magenta) immunostaining is seen in all layers of the caudal hypothalamus, as well as the anterior and posterior paraventricular organ (aPVO and pPVO). Each row shows a different z-plane, moving from dorsal to ventral. Scale bar = 50 μm. ( c) Higher magnification images of the cH, aPVO and pPVO from left side of image in ( c). ( d) Minimal overlap of Tg(116A:Gal4;UAS:nfsb-mCherry) (magenta) with dopaminergic neurons labeled by Tg(TH2:GCaMP5) (green). Note that the Tg(116A:Gal4;UAS:nfsb-mCherry) transgenic, which is used in ablation experiments, shows sparser labeling than with Tg(UAS:GFP). In this fish, 2 out of 17 (11.8%) of Tg(116A:Gal4;UAS:nfsb-mCherry) cells overlapped with Tg(TH2:GCaMP5) expression. Scale bar = 50 μm. ( e) Quantification of 5-HT overlap with Tg(116A:Gal4;UAS:GFP) in the cH, aPVO and pPVO. |