
Fig. 5-S1
- ID
- ZDB-FIG-200325-174
- Publication
- Wee et al., 2019 - A bidirectional network for appetite control in larval zebrafish
- Other Figures
- All Figure Page
- Back to All Figure Page
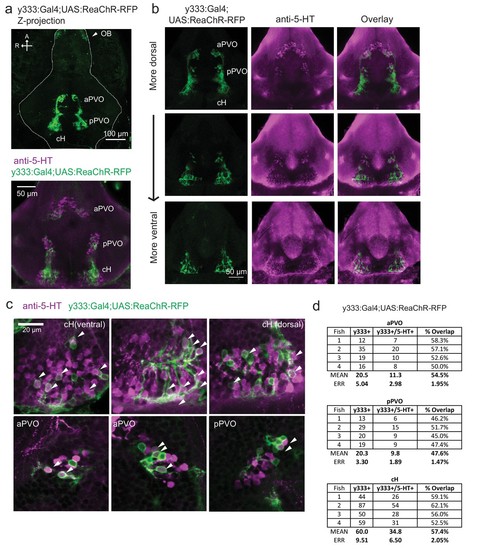
Characterization of the serotonergic identity of the y333:Gal4 line.( a) We used an alternative cH-labeling Gal4 line, Tg(y333:Gal4) ( Marquart et al., 2015) to drive Tg(UAS:ReaChR-RFP) expression, as we were unable to detect any Tg(116A:Gal4)-driven ReaChR expression on the basis of its Red Fluorescent Protein tag. Top: Whole mount confocal z-stack of a Tg(y333:Gal4;UAS:ReaChR-RFP) (green) shows relatively specific expression in the caudal hypothalamus, as well as some labeling in the olfactory bulb (white arrow) and other scattered cells. Scale bar = 100 μm. A = anterior, R = right. Bottom: Z-projection image of an isolated anti-5-HT (magenta) stained brain mounted ventral side up. Scale bar = 50 μm. ( b) Overlap of Tg(y333:Gal4;UAS:ReaChR-RFP) (green) with anti-5-HT immunostaining (magenta) visible in all layers of the caudal hypothalamus. There is also a lower amount of overlapping expression in the paraventricular organ (PVO). Each row displays a different z-plane, from dorsal (top) to ventral. Brains are mounted ventral side up. Scale bar = 50 μm. ( c) Higher magnification view showing moderate overlap of Tg(y333:Gal4;UAS:ReaChR-RFP) with anti-5-HT staining in the cH and PVO. Arrows indicate cells with overlapping RFP and 5-HT expression. Scale bar = 20 μm. ( d) Quantification of overlap between 5-HT and Tg(y333:Gal4;UAS:ReaChR-RFP) expression in the cH and PVO. |