
Fig. 4
- ID
- ZDB-FIG-200320-11
- Publication
- Daniel et al., 2019 - Spatiotemporal expression profile of embryonic and adult ankyrin repeat and EF-hand domain containing protein 1-encoding genes ankef1a and ankef1b in zebrafish
- Other Figures
- All Figure Page
- Back to All Figure Page
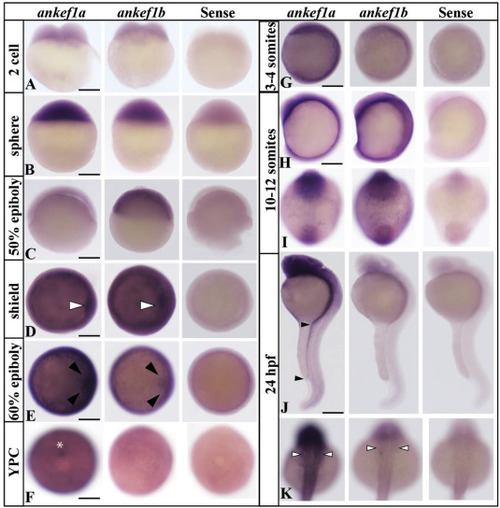
ankef1a and ankef1b are expressed in early embryos. Rows: A-C, G, H, and J are lateral views; Row D and E are animal pole view; Row F are vegetal pole views; Row I are ventral view; Row K are dorsal view. The white arrowheads at shield (D) and black arrowheads at 60% epiboly (E) indicate ankef1a and ankef1b expression along the site of involution and convergent extension during gastrulation. Note the DFCs indicated at the YPC stage (asterisk in F), which was not seen in ankef1b YPC-stage embryos. Black arrowheads in 24 hpf lateral view (J) indicates ankef1a expression along the dorsal side of the yolk extension. Otic vesicle expression of ankef1a is indicated by white arrowheads in the 24 hpf dorsal view (K). Scale bars for each stage = 200 μm. |
| Genes: | |
|---|---|
| Fish: | |
| Anatomical Terms: | |
| Stage Range: | 2-cell to Prim-5 |
Reprinted from Gene expression patterns : GEP, 34, Daniel, J.G., Panizzi, J.R., Spatiotemporal expression profile of embryonic and adult ankyrin repeat and EF-hand domain containing protein 1-encoding genes ankef1a and ankef1b in zebrafish, 119069, Copyright (2019) with permission from Elsevier. Full text @ Gene Expr. Patterns