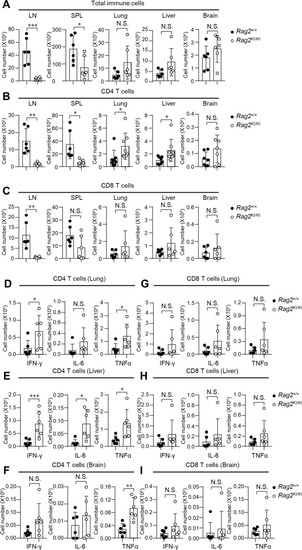
T cells that produced cachexia cytokines of Rag2KI/KI mice are disordered. (A) Total immune cells of lymph nodes (LN), spleen (SPL), lung, liver and brain from Rag2+/+ and Rag2KI/KI mice. Rag2+/+ mice (n = 6); Rag2KI/KI mice (n = 6). (B) The absolute CD4 T cells of LN, SPL, lung, liver and brain from Rag2+/+ and Rag2KI/KI mice. Rag2+/+ mice (n = 6); Rag2KI/KI mice (n = 6). (D–F) The disorder of IFN-γ, IL-6 and TNFα of CD4 T cells in lung (D), liver (E) and brain (F) from Rag2+/+ and Rag2KI/KI mice was analyzed. Rag2+/+ mice (n = 6); Rag2KI/KI mice (n = 6). (C) The absolute CD8 T cells of LN, SPL, lung, liver and brain from Rag2+/+ and Rag2KI/KI mice. Rag2+/+ mice (n = 6); Rag2KI/KI mice (n = 6). (G–I) The disorder of IFN-γ, IL-6 and TNFα of CD8 T cells in lung (G), liver (H) and brain (I) from Rag2+/+ and Rag2KI/KI mice was analyzed. Rag2+/+ mice (n = 6); Rag2KI/KI mice (n = 6). All cytokines were detected by flow cytometric analysis after in vitro stimulation with PMA (phorbol 12-myristate 13-acetate) and ionomycin in the presence of brefeldin A for 4 h. The error bars indicate the SDs. The data are presented as the mean ± standard deviation. *P < 0.05, **P < 0.01 and ***P < 0.001 by Student’s t test; N.S.: no significance.
|
