IMAGE

Figure 6

ID
ZDB-IMAGE-200314-33
Source
Figures for Sun et al., 2020
Image
Figure Caption

Figure 6

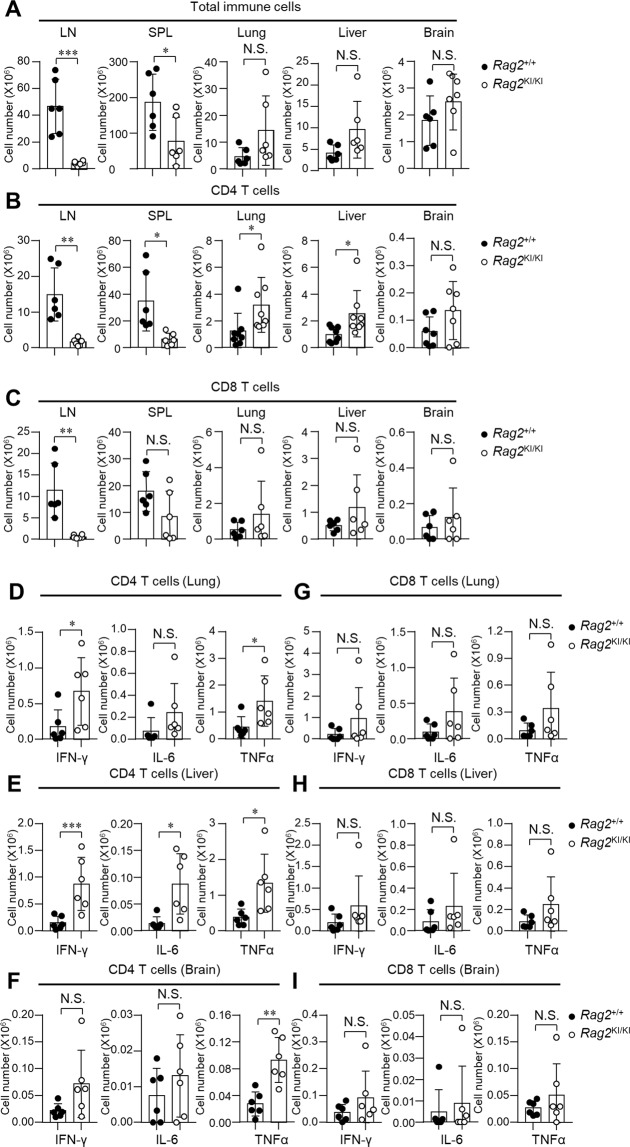
T cells that produced cachexia cytokines of Rag2KI/KI mice are disordered. (A) Total immune cells of lymph nodes (LN), spleen (SPL), lung, liver and brain from Rag2+/+ and Rag2KI/KI mice. Rag2+/+ mice (n = 6); Rag2KI/KI mice (n = 6). (B) The absolute CD4 T cells of LN, SPL, lung, liver and brain from Rag2+/+ and Rag2KI/KI mice. Rag2+/+ mice (n = 6); Rag2KI/KI mice (n = 6). (DF) The disorder of IFN-γ, IL-6 and TNFα of CD4 T cells in lung (D), liver (E) and brain (F) from Rag2+/+ and Rag2KI/KI mice was analyzed. Rag2+/+ mice (n = 6); Rag2KI/KI mice (n = 6). (C) The absolute CD8 T cells of LN, SPL, lung, liver and brain from Rag2+/+ and Rag2KI/KI mice. Rag2+/+ mice (n = 6); Rag2KI/KI mice (n = 6). (GI) The disorder of IFN-γ, IL-6 and TNFα of CD8 T cells in lung (G), liver (H) and brain (I) from Rag2+/+ and Rag2KI/KI mice was analyzed. Rag2+/+ mice (n = 6); Rag2KI/KI mice (n = 6). All cytokines were detected by flow cytometric analysis after in vitro stimulation with PMA (phorbol 12-myristate 13-acetate) and ionomycin in the presence of brefeldin A for 4 h. The error bars indicate the SDs. The data are presented as the mean ± standard deviation. *P < 0.05, **P < 0.01 and ***P < 0.001 by Student’s t test; N.S.: no significance.

Acknowledgments
This image is the copyrighted work of the attributed author or publisher, and ZFIN has permission only to display this image to its users. Additional permissions should be obtained from the applicable author or publisher of the image. Full text @ Sci. Rep.