
Figure 4
- ID
- ZDB-FIG-200208-26
- Publication
- Honkoop et al., 2019 - Single-cell analysis uncovers that metabolic reprogramming by ErbB2 signaling is essential for cardiomyocyte proliferation in the regenerating heart
- Other Figures
-
- Figure 1
- Figure 1—figure supplement 1.
- Figure 1—figure supplement 2.
- Figure 1—figure supplement 3.
- Figure 1—figure supplement 4.
- Figure 2
- Figure 3
- Figure 3—figure supplement 1.
- Figure 4
- Figure 4—figure supplement 1.
- Figure 5.
- Figure 6
- Figure 6—figure supplement 1.
- Figure 7
- Figure 7—figure supplement 1.
- All Figure Page
- Back to All Figure Page
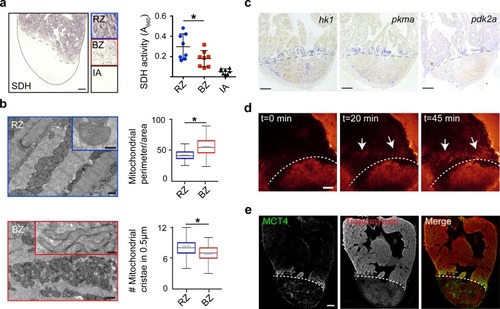
Border zone cardiomyocytes undergo a metabolic switch from mitochondrial OXPHOS to glycolysis. (a) Succinate dehydrogenase (SDH) enzyme staining on a seven dpi heart section with injury area separated by dashed line. Quantification of SDH activity in remote zone (RZ), border zone (BZ) and injury area (IA). Scale bar indicates 100 μm. Error bars indicate mean and standard deviation. (b) Transmission electron microscopy (TEM) images of mitochondria in cardiomyocytes from the remote zone and the border zone of a 7 dpi injured heart. Note the disorganized and irregular shaped mitochondria in the border zone cardiomyocyte. Scale bar 500 nm (200 nm in inserts). Graphs show quantification of mitochondrial perimeter-to-area as a measurement for roundness and quantification of mitochondrial cristae density. * p-value<0.05. (c) In situ hybridizations for glycolytic genes hk1, pkma and pdk2a on sections of injured zebrafish hearts at 7 dpi. Dashed line indicates injury site. Scale bars indicate 100 μm. (d) Time-lapse multi-photon confocal images of whole heart. The heart was isolated at 7 dpi and incubated with 2-NBDG, a fluorescent glucose analogue, at t = 0. Dotted line indicates injury area. Arrows point to regions of the border zone. Scale bar represents 100 μm. (e) Confocal image of injured zebrafish hearts at 7 dpi stained for the lactate transporter MCT4 (green) and Tropomyosin (red). Dashed line indicates injury site. |