
Figure 2
- ID
- ZDB-FIG-200208-23
- Publication
- Honkoop et al., 2019 - Single-cell analysis uncovers that metabolic reprogramming by ErbB2 signaling is essential for cardiomyocyte proliferation in the regenerating heart
- Other Figures
-
- Figure 1
- Figure 1—figure supplement 1.
- Figure 1—figure supplement 2.
- Figure 1—figure supplement 3.
- Figure 1—figure supplement 4.
- Figure 2
- Figure 3
- Figure 3—figure supplement 1.
- Figure 4
- Figure 4—figure supplement 1.
- Figure 5.
- Figure 6
- Figure 6—figure supplement 1.
- Figure 7
- Figure 7—figure supplement 1.
- All Figure Page
- Back to All Figure Page
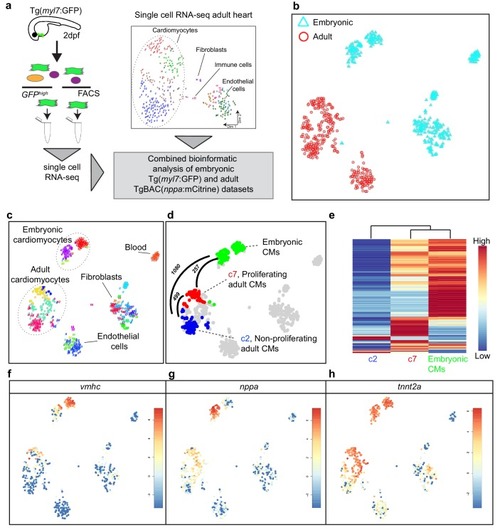
(a) Cartoon to illustrate the experimental procedure for single cell analysis of embryonic and adult cardiac cells. (b) tSNE map of combined adult (red) and embryonic datasets (light blue). (c) tSNE map indicating the different cell types based on marker gene expression. (d) tSNE map with the adult cardiomyocytes of the injured heart (cluster 7 in red, cluster 2 in blue and clusters 1 and 4 in gray) and embryonic (2 dpf) cardiomyocytes (in green), with number of pairwise differentially expressed genes (p-value<0.01) indicated between cardiomyocyte clusters. (e) Heatmap with hierarchical clustering based on the 500 most differentially expressed genes between clusters. Red color represents high expression, blue color represents low expression. Rows represent individual genes. (f–h) tSNE maps visualizing log2-transformed read-counts of vmhc (f), nppa (g) and tnnt2a (h). |