
Figure 1
- ID
- ZDB-FIG-200208-18
- Publication
- Honkoop et al., 2019 - Single-cell analysis uncovers that metabolic reprogramming by ErbB2 signaling is essential for cardiomyocyte proliferation in the regenerating heart
- Other Figures
-
- Figure 1
- Figure 1—figure supplement 1.
- Figure 1—figure supplement 2.
- Figure 1—figure supplement 3.
- Figure 1—figure supplement 4.
- Figure 2
- Figure 3
- Figure 3—figure supplement 1.
- Figure 4
- Figure 4—figure supplement 1.
- Figure 5.
- Figure 6
- Figure 6—figure supplement 1.
- Figure 7
- Figure 7—figure supplement 1.
- All Figure Page
- Back to All Figure Page
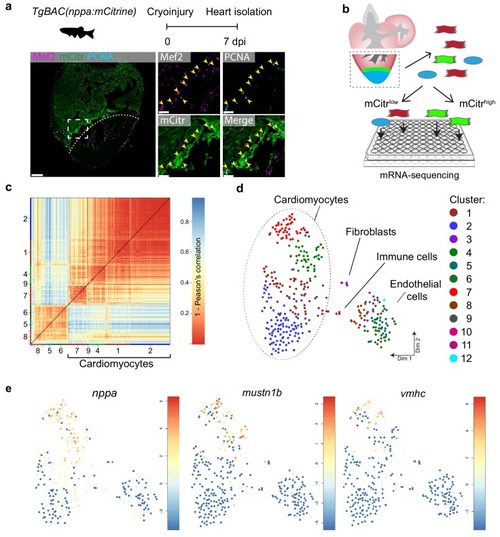
Single-cell mRNA sequencing identifies different cardiomyocyte-populations in the injured zebrafish heart. (a) Schematic of cryoinjury procedure on adult TgBAC(nppa:mCitrine) fish and immunohistochemistry on section of injured TgBAC(nppa:mCitrine) heart 7 dpi. Overview image on left and zoom-in of boxed region on the right. Mef2 (in magenta) labels cardiomyocytes, nppa:mCitrine (in green) marks the borderr zone, and PCNA (in cyan) marks proliferating cells. Arrows indicate triple-positive cells. Dashed line indicates injury site. Scale bar in overview 50 μm. Scale bar in zoom-ins 20 μm. (b) Experimental outline of the single-cell mRNA-sequencing of injured zebrafish hearts (blue, injury area; green, border zone) (c) Pairwise correlation between individual cells across all genes detected. Color-code indicates cell-to-cell distances measured by [1 – Pearson’s correlation coefficient]. StemID clusters are indicated by color and number on the x- and y-axis. (d) t-distributed stochastic neighbor embedding (tSNE) map representation of transcriptome similarities between individual cells. (e) tSNE maps visualizing log2-transformed read-counts of the border zone marker genes nppa, mustn1b and vmhc. |