FIGURE

Figure 2.1

ID
ZDB-FIG-200201-30
Publication
Thouvenin et al., 2020 - Origin and role of the cerebrospinal fluid bidirectional flow in the central canal
Other Figures
All Figure Page
Back to All Figure Page
Figure 2.1

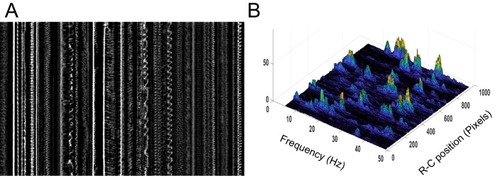
Motile cilia beating pattern in the central canal of 30 hpf embryos.

(A) Kymograph of motile cilia dynamics in the ventral central canal associated to Figure 2B1. Note the diversity of beating patterns of neighboring cilia. Not only cilia beat at many frequencies, but some of them also show unrepeatable patterns. Horizontal scale bar is 20 µm, and vertical scale bar is 0.5 s. (B) Corresponding power spectral density map showing the position of the different maximal frequencies for each cilium. Note that some cilia show a power spectrum with several local maxima, accounting for the asynchronicity of the beating patterns observed. In order to obtain the frequency map as in Figure 2B2, we extract only the global maximum.

Expression Data

Expression Detail
Antibody Labeling
Phenotype Data

Phenotype Detail
Acknowledgments
This image is the copyrighted work of the attributed author or publisher, and ZFIN has permission only to display this image to its users. Additional permissions should be obtained from the applicable author or publisher of the image. Full text @ Elife