|
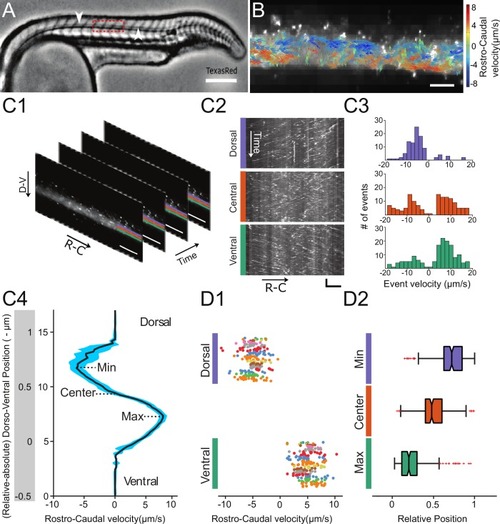
Automated CSF flow analysis in the central canal quantifies the bidirectional velocity profile in 30 hpf embryos.(A) Inverted contrast widefield image showing a 30 hpf zebrafish embryo injected with Texas Red: Texas Red fills all fluid-containing cavities, including ventricles, central canal (CC, white arrows), floor plate, somite boundaries, and blood vessels. (B) Instantaneous velocities of 20 nm fluorescent particles, as measured with a particle tracking velocimetry (PTV) algorithm, inside the central canal in a region corresponding to the red box in (A). The length, direction, and color of all arrows are coded according to the instantaneous bead velocity, ranging from −8 (blue) to 8 μm/s (red). (C1) Time series showing subsequent images of fluorescent beads injected in the DV and transported down the CC used to generate kymographs at different dorso-ventral (D–V) positions. (C2) Example kymographs computed in a dorsal, central, or ventral position in the CC. Each line represents the trajectory of one bead, projected along the rostro-caudal (R–C) axis. The slope of each trajectory gives a bead velocity projected onto the R-C axis. (C3) Histogram of velocities obtained at the three positions shown in (C2). (C4) Velocity profile (mean ± s.e.m. in blue) calculated for all D-V positions (expressed in absolute and relative position) in the CC for one WT embryo showing a maximum in the ventral side and a minimum in the dorsal side. (D1) Values of minimal (extremum in the dorsal part) and maximal velocities measured on 110 WT zebrafish embryos. Each dot represents the extremal values of one profile, and each color presents an experiment performed on siblings. 2 R-C positions are sampled per embryo. Extremal velocities are respectively 4.78 ± 0.79 μm.s-1 (ventral CC) and - 4.80 ± 0.82 μm.s-1 (dorsal CC). (D2) Values of relative D-V position of minimal, null, and maximal speed in the dorsal, center and ventral position in the CC (median positions are respectively 0.82, 0.53, and 0.29). Horizontal scale bar is 150 μm in (A), 15 μm in (B, C1, C2), and vertical scale bar is 5 s in (C2).
|