
Fig. 7
- ID
- ZDB-FIG-200130-35
- Publication
- Dasyani et al., 2019 - Lineage tracing of col10a1 cells identifies distinct progenitor populations for osteoblasts and joint cells in the regenerating fin of medaka (Oryzias latipes)
- Other Figures
- All Figure Page
- Back to All Figure Page
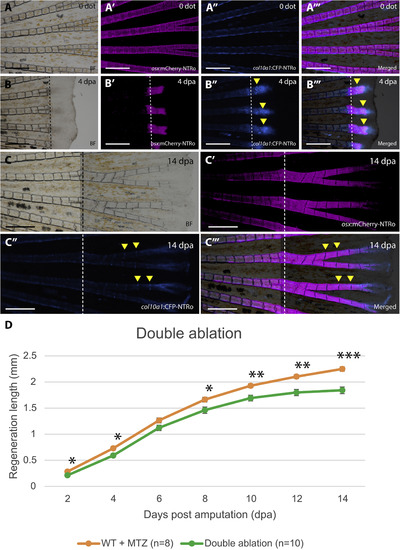
Fin regeneration after double ablation of osx and col10a1 cells. A,B: Images of fins before double ablation (A) and in regenerates at 4 dpa (B) showing bright field (A,B), osx:mCherry-NTRo (A′,B′), col10a1:CFP-NTRo (A″,B″), as well merged images (A‴,B‴). Dotted lines indicate amputation planes. Scale bars = 0.5 mm. C: Fins at 14 dpa. Image arrangement as in A and B. D: Length of fin regenerates after double ablation of osx and col10a1 cells. At 14 dpa, fins depleted of osx and col10a1-positive cells show a 19% reduction in the length of regenerates as compared to wild-type control fish treated with Mtz (*P < 0.05; **P < 0.005; ***P< 0.0001). Data are represented as mean ± SEM. |
Reprinted from Developmental Biology, 455(1), Dasyani, M., Tan, W.H., Sundaram, S., Imangali, N., Centanin, L., Wittbrodt, J., Winkler, C., Lineage tracing of col10a1 cells identifies distinct progenitor populations for osteoblasts and joint cells in the regenerating fin of medaka (Oryzias latipes), 85-99, Copyright (2019) with permission from Elsevier. Full text @ Dev. Biol.