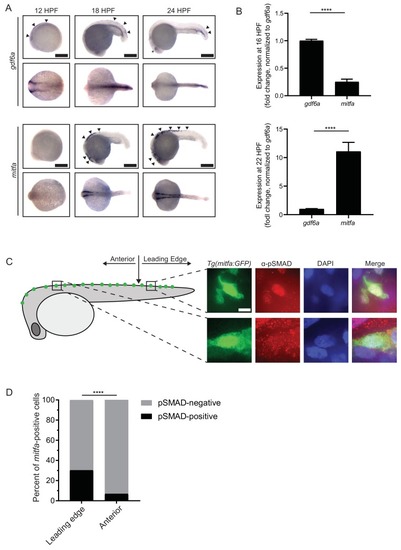
gdf6a expression and BMP activity in pigment progenitor cells. (A) RNA in situ hybridization for gdf6a (top) and mitfa (bottom) at 12-, 18-, and 24 hr post-fertilization. Arrowheads indicate expression domains in the region of the neural crest of gdf6a and mitfa. Asterisk indicates known dorsal retinal expression of gdf6a. Scale bar = 500 µm. (B) Expression of gdf6a and mitfa from neural crest cells isolated from Tg(crestin:eGFP) embryos by FACS at 16 HPF and 22 HPF. Samples were normalized to gdf6a expression. n = 5–6 replicates per conditions from two independent experiments (N = 2). (C) Images of GFP-positive cells from Tg(mitfa:eGFP) zebrafish stained with α-pSMAD 1/5/8 antibody. Scale bar = 10 µm. (D) Quantification of mitfa:eGFP-positive cells that are phospho-SMAD1/5/8-positive. The leading edge encompassed the five most posterior mitfa-positive cells, whereas anterior cells constituted any mitfa-positive cells anterior to the leading edge. n = 102 and 186 for distal leading edge and anterior cells, respectively, from three independent experiments (N = 3). P-values were calculated using Fisher’s exact test for panels B and D, ****p<0.0001.
|
