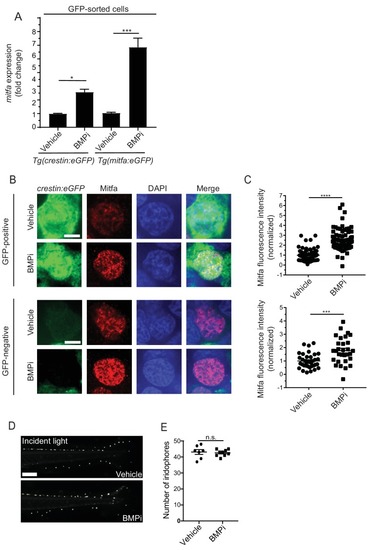
BMP signaling regulates expression of and acts through mitfa to impact pigment cell fates. (A) mitfa expression in sorted GFP-positive cells from Tg(crestin:eGFP) and Tg(mitfa:eGFP) embryos treated with vehicle or BMPi from 12 to 24 HPF, n = 4–5 replicates for each condition from two independent experiments (N = 2). (B) anti-Mitfa immunofluorescence, DAPI and merged images of Tg(crestin:eGFP) embryos treated with vehicle control or BMPi in GFP-positive cells (top) and GFP-negative cells (bottom), scale bar = 5 µm. (C) Quantification of anti-Mitfa fluorescence intensity of individual nuclei in GFP-positive cells (top) and GFP-negative cells (bottom); n = 65 and 74 for GFP-positive vehicle and BMPi groups, respectively; n = 35 and 30 for GFP-negative vehicle and BMPi groups, respectively, from three independent experiments (N = 3). (D) Incident light images of mitfa(lf) embryonic zebrafish treated with vehicle or BMPi from 12 to 24 HPF and imaged at 5 DPF, scale bar = 1 mm. (E) Quantification of dorsal iridophores in mitfa(lf) embryonic zebrafish treated with vehicle or BMPi from 12 to 24 HPF, n = 7 and 9 for vehicle and BMPi groups, respectively, from two independent experiments (N = 2). Error bars represent mean + /- SEM, P-value was calculated using one-way ANOVA with Tukey’s multiple comparisons test in panel A and Student’s t-test in panel C and E. *p<0.05, ***p<0.001, ****p<0.0001, n.s., not significant.
|
