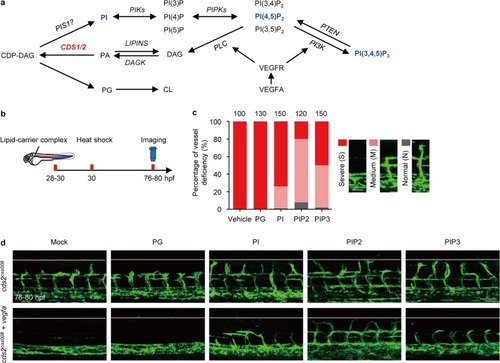
PI-PIPs metabolism is involved in CDS2-deficient vessel regression. a Schematic diagram of CDS2-controlled phosphoinositide recycling. DAG, diacylglycerol; PA, phosphatidic acid; PIS1, phosphatidylinositol synthase 1; PI, phosphoinositol; PIK, phosphoinositol 3/4/5-kinase; PIPK, phosphatidylinositol 4/5-phosphate 5/4-kinase; PTEN, phosphatase and tensin homolog; PI3K, phosphoinositide 3 kinase; PLC, phospholipase c; PG, phosphatidylglycerol; CL, cardiolipin. b Model of timing for phospholipid-carrier mixture microinjection, heatshock induction and confocal imaging analysis in (c) and (d). c Quantification of rescue effects of different phospholipids (PI, PG, PIP2 and PIP3) on vegfa OE-induced ISV regression in cds2 mutant embryos. Bars show percentages of vessel deficiency. The representative images of classified vascular phenotype are shown on the right. The counted ISV numbers were shown on the top, 10 ISV per embryo. d Representative images of trunk vessels from cds2 mutants at 76–80 hpf with or w/o vegfa OE and with microinjection of lipid–carrier complex, including PG, PI, PIP2 or PIP3 at 28–30 hpf. Scale bars, 50 μm (c) and 100 μm (d)
|
