
Figure 6—figure supplement 1.
- ID
- ZDB-FIG-191230-558
- Publication
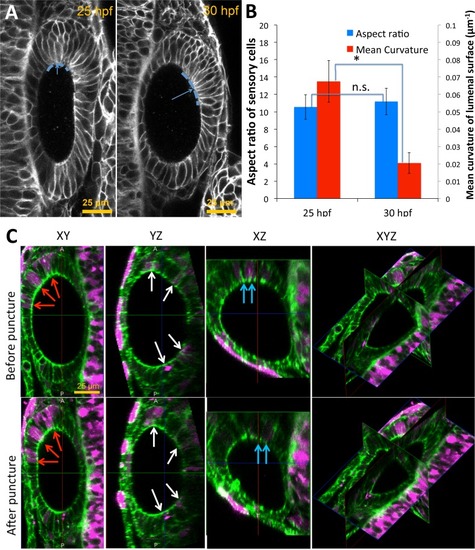
- Mosaliganti et al., 2019 - Size control of the inner ear via hydraulic feedback
- Other Figures
- All Figure Page
- Back to All Figure Page
( |