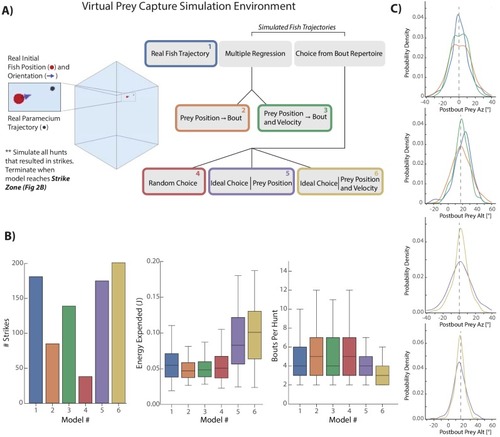
Figure 4.

Virtual prey capture simulation reveals necessity of velocity perception.

(A) A virtual prey capture environment mimicking the prey capture tank was generated to test three different types of models, and six models overall, described in the schematic. Models control a virtual fish consisting of a 3D position (red dot) and a 3D unit vector pointing in the direction of the fish’s heading. Virtual fish are started at the exact position and rotation where fish initiated hunts in the dataset. Prey trajectories are launched that reconstruct the real paramecium movements that occurred during hunts. The virtual fish moves in bouts timed to real life bouts, and if the prey enters the strike zone (defined by the distributions in Figure 2B, Materials and methods), the hunt is terminated. (B) Barplots (total #) and box plots (median and quartiles) showing performance of all six models in success (# Strikes), energy use per hunt sequence, and how many bouts each model performed during the hunt (a metric of hunt speed). (C) KDE plots showing the distribution of Post-Bout Prey Az and Post-Bout Prey Alt distributions for each model during virtual hunts. Dotted lines demark the strike zone mean.

Expression Data

Expression Detail
Antibody Labeling
Phenotype Data

Phenotype Detail
Acknowledgments
This image is the copyrighted work of the attributed author or publisher, and ZFIN has permission only to display this image to its users. Additional permissions should be obtained from the applicable author or publisher of the image. Full text @ Elife