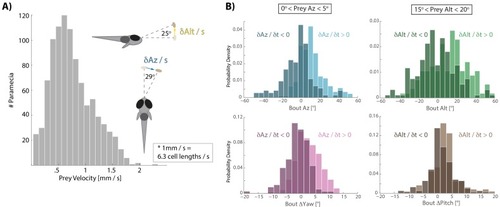
Figure 3—figure supplement 1.

Distribution of prey velocity and example prey velocity-based biasing of bout features.

(A) Distribution of 3D velocities of prey hunted by fish in our study. Mean azimuth and altitude velocities (absolute value) are shown in reference to the fish, averaged over 80 ms before pursuit bout initiation, which is the time interval of all velocity calculations implemented here. (B) Example histograms for two 5° windows of prey space, as shown in Figure 3A,B. Again, light colors indicate that prey are moving away from the fish and dark moving toward. If prey are 0–5° to the right of the fish, but swimming toward the fish in azimuth, the fish will actually turn and displace left, predicting that the prey will cross its midline. If swimming away, fish turn and displace to the right. In a window 15–20° above the fish in altitude, the fish will actually ‘wait’ for prey with downward velocity (i.e. Bout Alt ~0°), anticipating that the prey will arrive in the strike zone. Otherwise if prey are moving upwards, fish displace and rotate upwards.

Expression Data

Expression Detail
Antibody Labeling
Phenotype Data

Phenotype Detail
Acknowledgments
This image is the copyrighted work of the attributed author or publisher, and ZFIN has permission only to display this image to its users. Additional permissions should be obtained from the applicable author or publisher of the image. Full text @ Elife