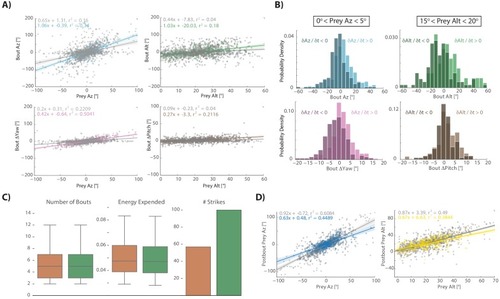
Figure 2—figure supplement 1.

Prey capture algorithm during aborted hunt sequences.

(A) Regression fits between prey position and bout variables during hunt sequences ending in an abort. Gray points and lines represent the last three pursuit bouts before the quit bout occurs, colors are all bouts between initiation and the last 3. The algorithm strongly resembles Figure 2 transformations at the beginning of hunt sequences that will eventually end in aborts, but goes awry in the last three bouts before quitting. (B) Pursuit bouts during abort sequences show modulation by velocity at inflection points similar to Figure 3—figure supplement 1B. (C) Orange model is the same as Figure 4 (Orange Model 2), which issues bouts based on multiple regression to prey position variables only. Green model is same as Figure 4 (Green Model 3), which issues bouts based on multiple regression to prey position and velocity variables. However, both are fit using pursuit bouts during aborted sequences (outside of the last three bouts before quitting) instead of strike sequences (i.e. Figure 4). As with models fit on strike sequences, multiple regression using prey position and velocity outperforms position only regression due to proportional velocity modulation. Both models are fed the exact same prey trajectories as models in Figure 4. Fitting on pursuit bouts during aborted sequences thus shows similar performance levels to models fit on strike sequences.

Expression Data

Expression Detail
Antibody Labeling
Phenotype Data

Phenotype Detail
Acknowledgments
This image is the copyrighted work of the attributed author or publisher, and ZFIN has permission only to display this image to its users. Additional permissions should be obtained from the applicable author or publisher of the image. Full text @ Elife