|
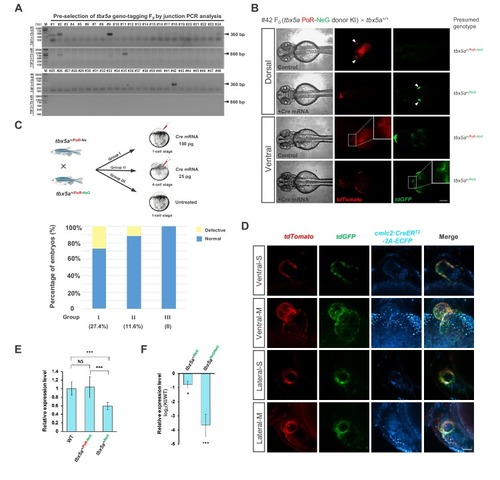
Evaluation of the <italic>tbx5a</italic> geno-tagging effect.(A) Preselection of tbx5a geno-tagging F0 individual by junction PCR analysis. 5’ or 3’ junctions were amplified by PCR using genomic DNA extracted from fin clips of the #1, #2, #9, #11, #24 and #42 F0 adult fish. The corresponding primer pairs are shown on the left side of the gel images, and the positions of these primers can be found in Figure 3A. (B) Switching of fluorescent signals achieved from the tbx5a geno-tagging allele after Cre mRNA injection into the F1 progeny from #42 positive F0 outcrossed with a wild-type zebrafish. The arrowheads indicate pectoral fins. The outlined boxed areas indicate the heart region, showing the change in the fluorescent signals in the heart before and after Cre mRNA injection. Scale bar, 200 μm. (C) The experimental design for the functionality test of the tbx5a geno-tagging allele. The progeny from the cross of a tbx5a+/PoR-NeG heterozygote with a tbx5a+/PoR-Ne heterozygote were divided into three groups: Group I was injected with 100 pg Cre mRNA at the one-cell stage, Group II was injected with 25 pg Cre mRNA in a single cell at the 4 cell stage, and Group III remained untreated as a control. The histogram shows the ratio of defective embryos after Cre mRNA injection in different groups. (D) Confocal images of the heart regions of two embryos from the cross of Tg(cmlc2:zCreERT2-2A-ECFP) transgenic fish with tbx5a PoR-NeG/PoR-NeG after 4-HT treatment, showing a red to green change in the fluorescent signals upon Cre induction. -S: Single-plane view, -M: Maximum intensity projection view of z-stack images. Scale bar, 50 μm. (E) qRT-PCR results showing the transcription level of the tbx5a locus in wild-type (WT) and tbx5a PoR-NeG geno-tagging donor KI zebrafish embryos at 72 hpf, using T5qF and T5qR primers. The tbx5a+/NeG and tbx5a+/PoR-NeG embryos were obtained from crosses of tbx5aPoR-NeG/PoR-NeG homozygotes with wild-type zebrafish with or without the injection of Cre mRNA, respectively. The average expression level of wild-type embryos was set as 1. (F) qRT-PCR results using T5qF and T5qR primers, showing the transcription level of the tbx5a locus in the tbx5a+/NeG and tbx5aNeG/NeG embryos derived from the Cre mRNA-injected tbx5a+/PoR-NeG and tbx5aPoR-NeG/PoR-NeG embryos, respectively. The original embryos were obtained from the crossing of tbx5aPoR-NeG/PoR-NeG homozygotes with tbx5a+/PoR-NeG heterozygote zebrafish. The expression levels in the KI embryos were normalized to the WT ones. Data are presented as the mean ±s.d., and a two-tailed Student’s t-test was applied to calculate p values in all the experiments. *: p<0.05. ***: p<0.001. NS: Not significant.
|