FIGURE

Fig 6

ID
ZDB-FIG-191230-1332
Publication
Diana et al., 2019 - Bayesian inference of neuronal assemblies
Other Figures
All Figure Page
Back to All Figure Page
Fig 6

Networks of assemblies in the zebrafish tectum.

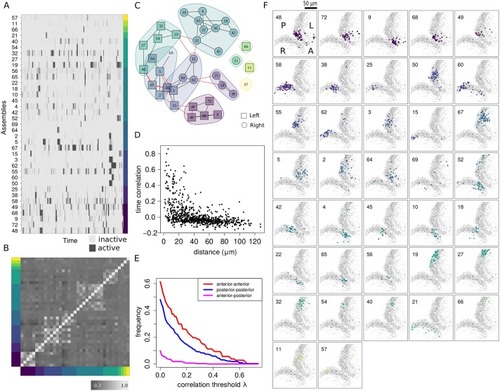
(A) Raster plot of assembly activity ordered according to subnetwork membership as shown in C. (B) Raster plot of the time correlation matrix (Pearson’s) between all pairs of assemblies averaged across posterior samples and sorted according to subnetwork membership. (C) Subnetwork graphs representing the time correlations among neuronal assemblies (see Materials and methods). Each assembly is a node, shorter edges reflect higher temporal correlations. Note the absence of edges between assemblies located in ipsilateral anterior and posterior tectum (see S3 Video). (D) Scatter plot showing the relationship between time correlation and physical distance between neuronal assembly centers (1pixel ≈ 0.9μm). (E) Fraction of assembly pairs with correlation larger than λ as a function of λ. Ipsilateral pairs of assemblies located at opposite sides in the anterior-posterior axis display a significant reduction in correlation compared to neighboring assembly pairs (anterior-anterior and posterior-posterior). (F) Locations of all assemblies from a single larva (see S2 Video for the assembly distributions in 3D). Each assembly is color-coded according to subnetwork memberships shown in C.

Expression Data

Expression Detail
Antibody Labeling
Phenotype Data

Phenotype Detail
Acknowledgments
This image is the copyrighted work of the attributed author or publisher, and ZFIN has permission only to display this image to its users. Additional permissions should be obtained from the applicable author or publisher of the image. Full text @ PLoS Comput. Biol.