FIGURE

Fig 4

ID
ZDB-FIG-191230-1329
Publication
Diana et al., 2019 - Bayesian inference of neuronal assemblies
Other Figures
All Figure Page
Back to All Figure Page
Fig 4

Imaging of the zebrafish tectum.

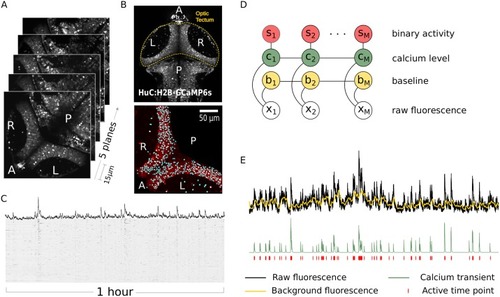
(A) Volumetric 2-photon imaging of both tectal hemispheres showing anterior/posterior (A/P) and right/left (R/L) axis of the zebrafish optic tectum. We monitored activity in the tectum of immobilized zebrafish larvae kept in total darkness. In all experiments we recorded calcium activity for 1 hour throughout 5 planes, 15μm apart with an acquisition frequency of 4.8Hz per volume. (B) Raw images (top) were segmented (bottom) to obtain the temporal dynamics of calcium of thousands of neuron in the tectum (see also S1 Video). (C) Raster plot showing calcium activity of all neurons over 1h recording. (D) Raw fluorescence is described in terms of a Hidden Markov model (HMM) where periods of increased activity are indicated by a binary process ({s}) triggering the onset of calcium transients ({c}). The recorded fluorescence is obtained as the sum of calcium level and a Wiener process to account for the low-frequency baseline modulation ({s}) (see Materials and methods). (E) Example of raw fluorescence and estimation of hidden variables of the HMM using a sequential maximum-likelihood algorithm (see Materials and methods).

Expression Data

Expression Detail
Antibody Labeling
Phenotype Data

Phenotype Detail
Acknowledgments
This image is the copyrighted work of the attributed author or publisher, and ZFIN has permission only to display this image to its users. Additional permissions should be obtained from the applicable author or publisher of the image. Full text @ PLoS Comput. Biol.