FIGURE

Fig 5

ID
ZDB-FIG-191230-1074
Publication
Marquart et al., 2019 - Prepontine non-giant neurons drive flexible escape behavior in zebrafish
Other Figures
All Figure Page
Back to All Figure Page
Fig 5

Delayed escape trajectories are guided by visual information.

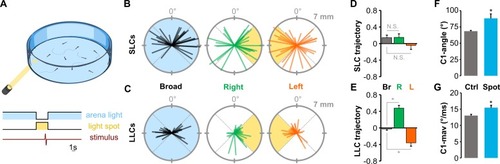
(A) Schematic of experiment measuring escape direction under broad-field illumination or in darkness with only a light spot illuminated. Scale bar 1 s. (B-C) Thirty representative SLC (B) and LLC (C) escape trajectories of larvae to a nondirectional acoustic/vibratory stimulus when under broad-field illumination (“Broad”) or when oriented to the left or to the right of a light spot. Escape direction is plotted radially and net displacement axially. (D-E) Mean direction choice (−1 all left; +1 all right) for SLC (D) and LLC (E) responses under broad-field illumination (“Br”; SLC, n = 367 responses; LLC, n = 372) or when the light-spot was to the left (“L”; SLC, n = 131 responses; LLC, n = 257) or to the right of the larva (“R”; SLC n = 143; LLC, n = 283). *p < 0.001, t test. (F-G) Mean initial bend angle (F) and maximum angular velocity (G) for LLCs performed under broad-field illumination (gray) or during directionalized responses with a light spot. *p < 0.01, t test. Underlying numerical data are included in S1 Data. Ctrl, control; LLC, long-latency C-start; N.S., not significant; SLC, short-latency C-start.

Expression Data

Expression Detail
Antibody Labeling
Phenotype Data

Phenotype Detail
Acknowledgments
This image is the copyrighted work of the attributed author or publisher, and ZFIN has permission only to display this image to its users. Additional permissions should be obtained from the applicable author or publisher of the image. Full text @ PLoS Biol.